VCF9 - Building a VCF Operations Dashboard
A short blog about the joys of creating a dashboard in VCF 9 Operations.
3044 Words // ReadTime 13 Minutes, 50 Seconds
2025-12-20 03:00 +0100
Introduction
I currently have two different systems in my home lab for monitoring things. I started everything but never really finished it. I have a Grafana dashboard for power consumption and an Uptime Kuma to check the general availability of systems. As I have to run a VCF Operations anyway so that I can license my Baselab, I thought, why not use Operations for monitoring purposes, since it’s there anyway.
How hard can it be? Spoiler alert: I never thought I’d be building a Docker container, using a proxy, and converting things with Python, but let’s dive down the rabbit hole.
First things first, where do we start?
In VCF 9, the Management Pack Builder is integrated into Operations. Management Pack Builder? Yes, that’s the tool I’ve probably seen the most over the last few days. The MP allows you to integrate external systems or data sources and use them to create metrics and properties. Sounds simple, and it is—in theory. But first you have to find the tool, because it has been well hidden in Operations. You can find the MP under Administration -> Integrations -> Marketplace and then access it via the Create Management Pack button or or Developer Center -> Managment Pack Builder.
My first management pack
I will describe the process using the Unraid API as an example. My UPS itself does not have an API, but my Unraid storage system can read my UPS data via a USB connection. Since Unraid 7.2, there is now also an API that provides me with the data - nice.
In principle, however, it can be said that depending on the API, MP can be super easy or hellish. More on that later. Unraid relies on GraphQL, which is ideal for VCF operations and, after a brief period of familiarization with how to access the data, is very easy to use. The nice thing is that there is exactly one endpoint, namely /graphql, and Unraid has a built-in Apollo server where you can easily click together your queries.
Define sources
First, a source must be defined in MP, which is usually relatively easy. But here’s the first stumbling block: please use variables if you are using anything other than Basic Auth.
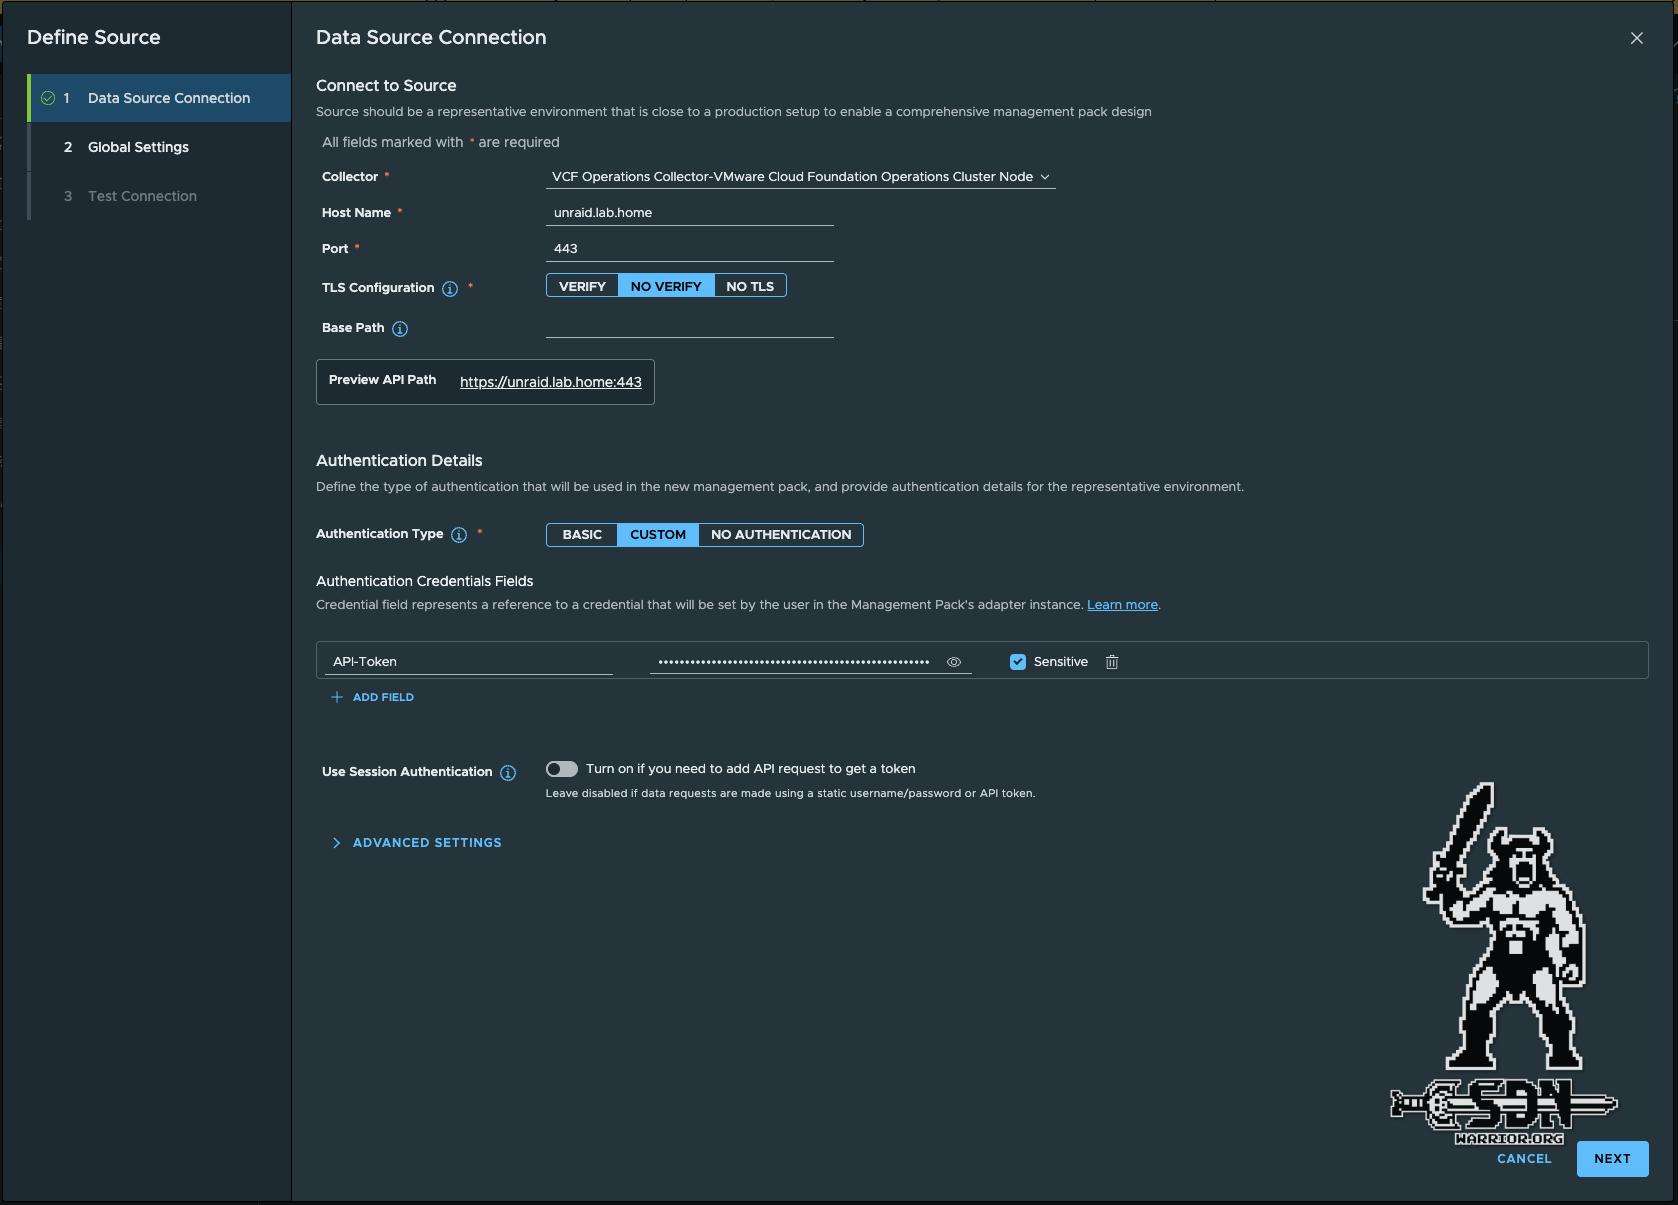
Data Source Connection (click to enlarge)
The data source serves as a template, which is used to develop the management pack. Once the management pack has been created, there are no more credentials in the data source, provided that you have followed the guidelines and not entered any credentials without variables. If you use basic authentication, variables are used automatically.
The actual configuration is fairly straightforward. you have to select a collector, the API endpoint, and the port. I have disabled certificate verification, but in production it should of course remain enabled. The base path is optional; for Unraid, graphql would be a good choice. You don’t have to specify a leading /, this is done automatically. Since Unraid uses API tokens, I created a variable called API-Toke via Custom Authentication.
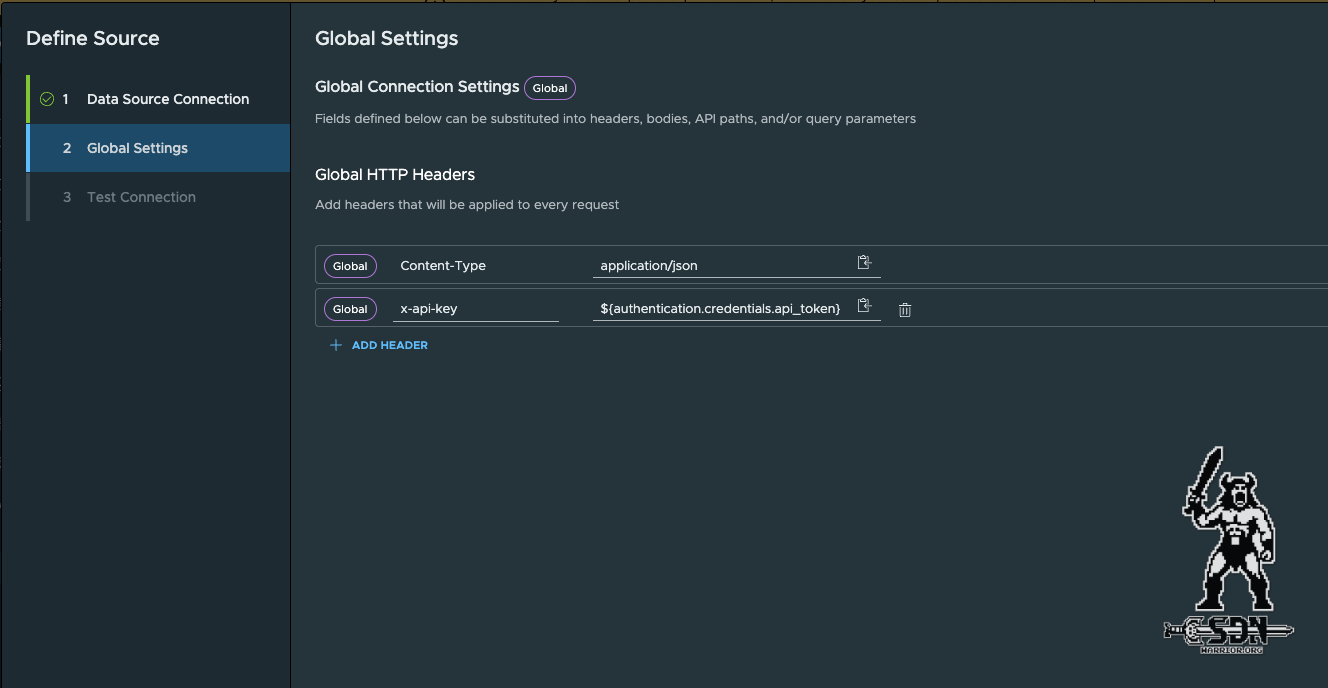
Global Settings (click to enlarge)
Next are the global settings, which are very API-specific, and I will show another variation with the Veeam API later on. Unraid is relatively simple here; content type - application/json is more or less standard for most APIs, and my token must be specified in the HTTP header with x-api-key. The small paste icon allows you to access the defined variables, and everything is automatically entered correctly so that the previously defined variable is used.
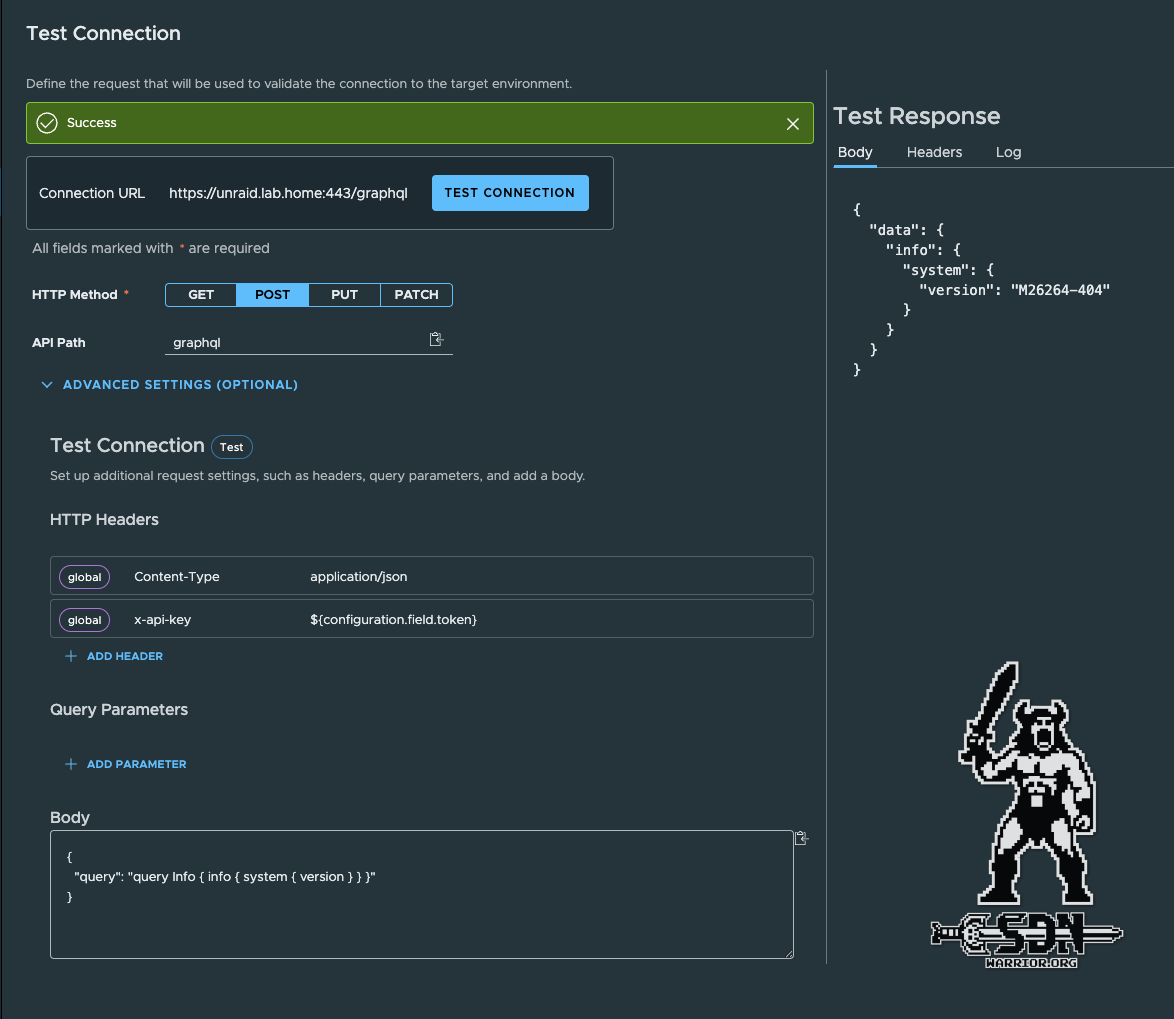
Test Connection (click to enlarge)
The final step is to test the connection. If the test is not successful, the connection cannot be saved. Any query can generally be used. In my example, I display the system version of my Unraid server. Unraid only uses POST queries. The global HTTP headers are added automatically.
To query data, you have to send a query in the body with Unraid. This is again very specific.
If everything works, you will receive a valid response on the right-hand side and you can save the connection. Step 1 is now successfully complete.
Create Requests
Next, the requests must be created. These requests will then be used later to retrieve the data.
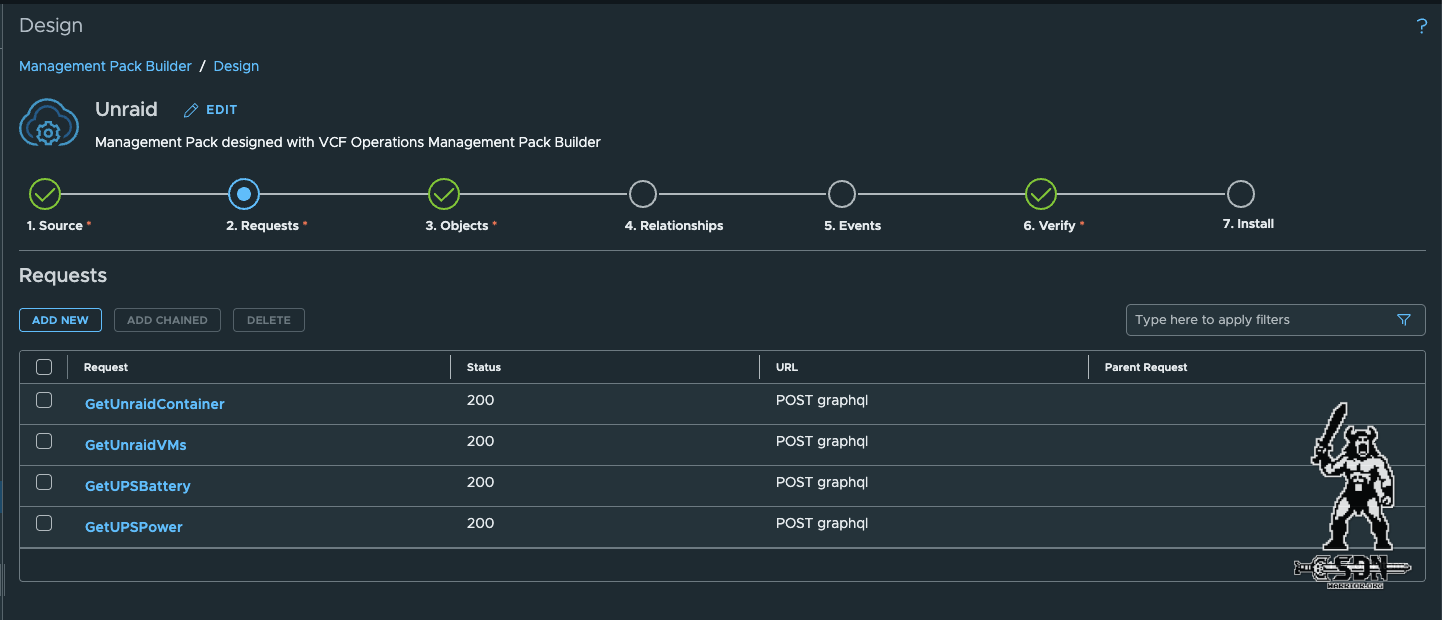
Requests (click to enlarge)
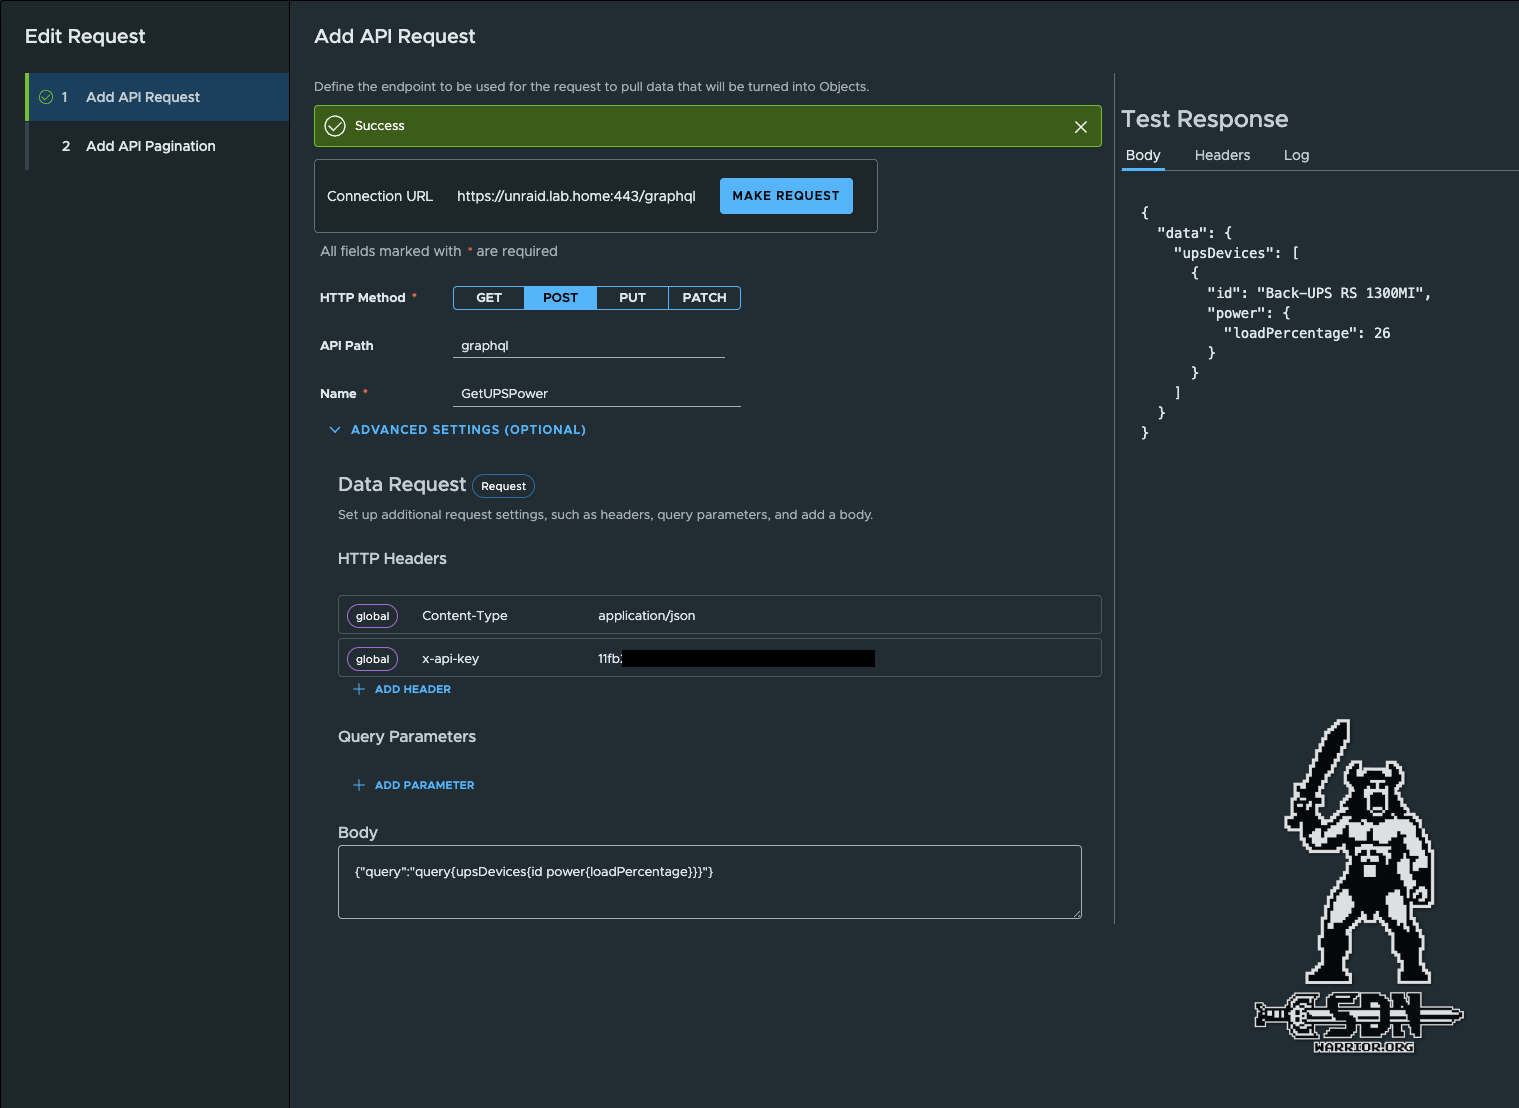
API Requests (click to enlarge)
In my example, I query the utilization of my UPS via the Unraid API so that I can use the data later in an object. And as you can see here, I didn’t follow my own recommendation for this request and my API token is hardcoded in the request. Please do better. In my defense, that was my first request, and I will adjust it in the next update of the management pack.
Create Objects
Next, the objects must be created. Each object needs at least one identifier, which must be unique, and an object can contain several metrics and/or properties. Metrics and properties are not mandatory. An object can therefore consist of metrics only or properties only. The difference between metrics and properties is quite simple: metrics can be calculated and must be of the decimal data type, while properties are strings. The unique ID is implemented via a property. Each object can only receive data via one request.
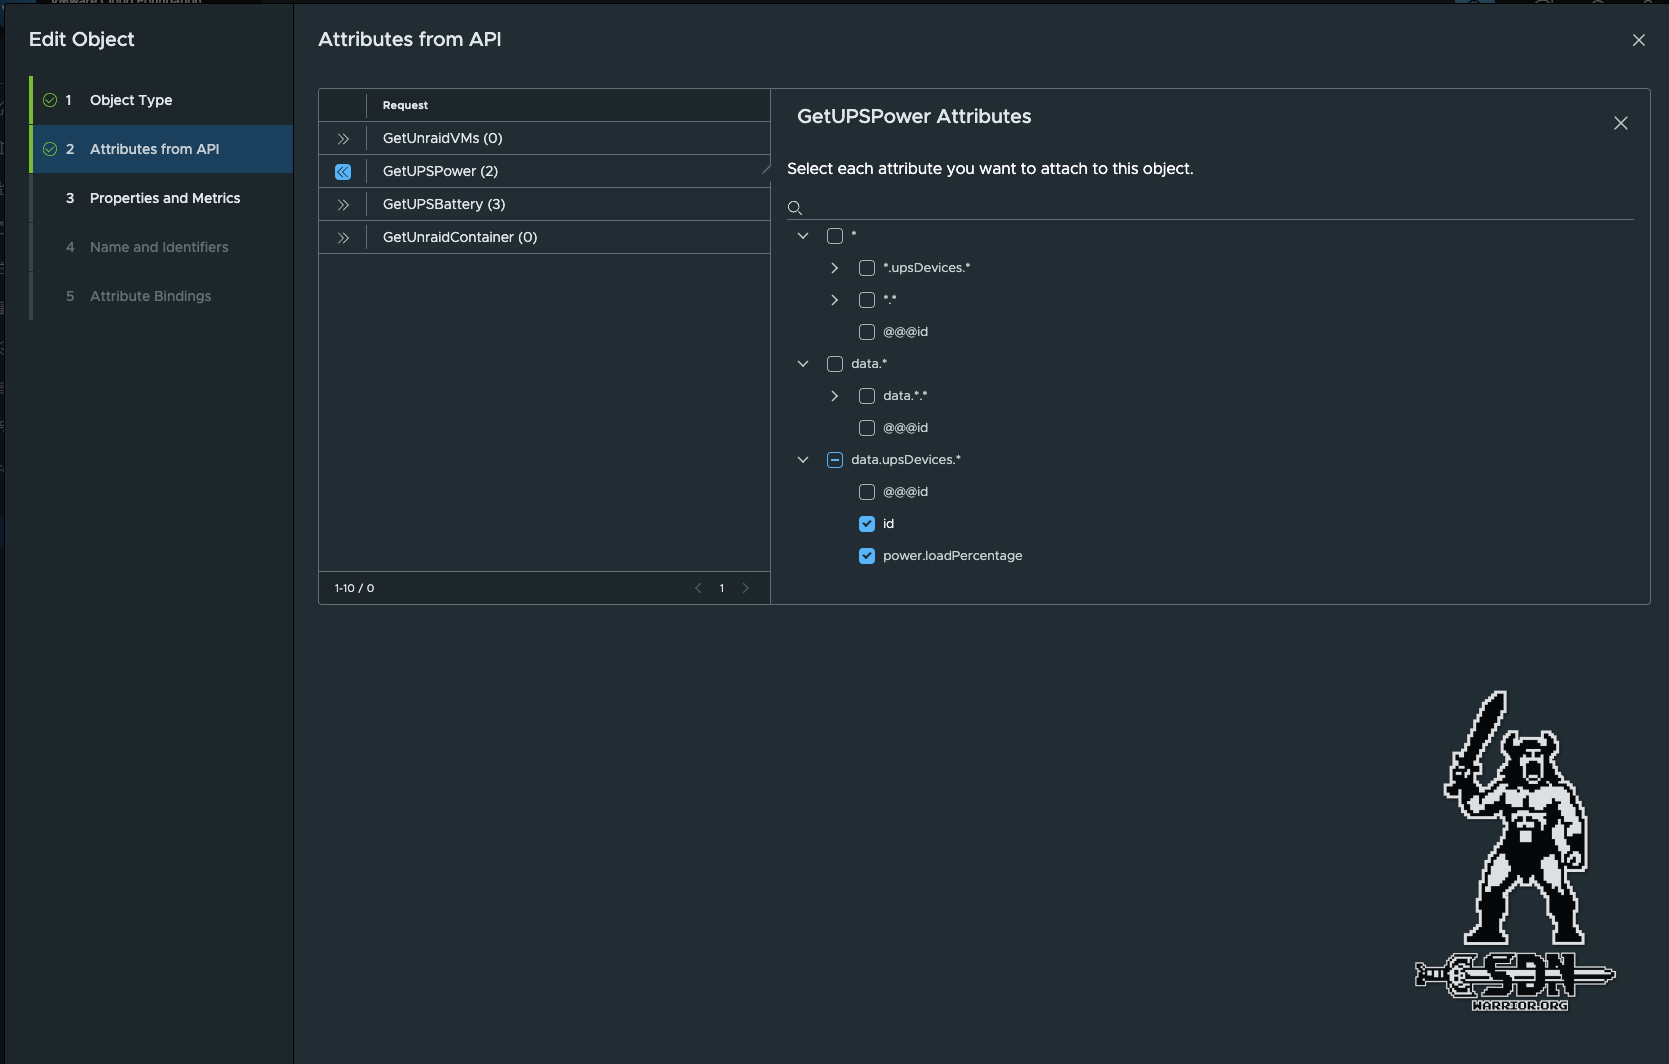
Objects (click to enlarge)
When selecting the attributes, it is important to pay close attention to what is selected and always rely on the result of the API. In the end, clearly assignable values are required. Arrays such as upsDevices.* or data.* are not suitable for metrics. In this case, data.upsDevices.* must be selected, as all results always belong to exactly one upsDevice and can therefore ideally represent an object. If there are several UPS systems in upsDevices, several objects are automatically created.
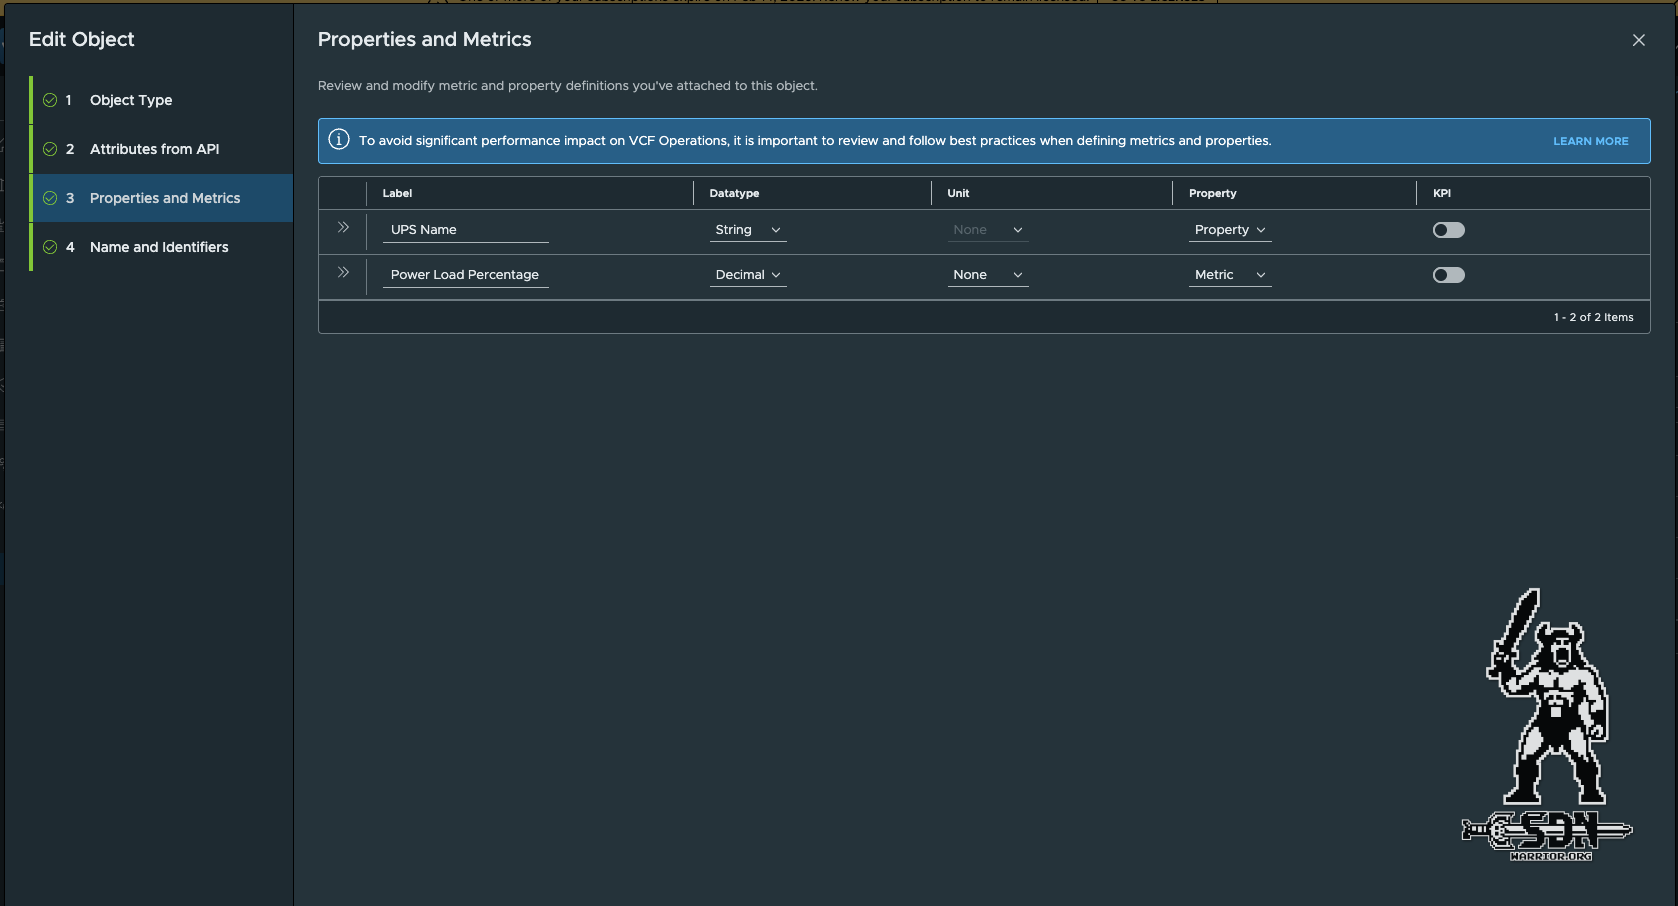
Properties and Metrics (click to enlarge)
Selecting the metrics and properties is super simple, but at the same time it’s the biggest problem when dealing with APIs. Unfortunately, you can’t convert the results in any other way; it’s either a string or a decimal. It’s the same as when you only have a hammer, then suddenly everything looks like a nail. In my cases with different APIs, almost everything was a stirng. At least with Decimal, you can still specify the most common units, such as %, bit, byte, byte/s, and so on.
Finally, you just need to select a property as the object instance name and an object ID, which must of course be unique. Since I only have one UPS, I can use the UPS name as both the object instance name and the object ID.
Finally, a verification must be performed before the Management Pack can be installed. Relationshops and events are optional, and for my purposes, I do not need them at this time and will therefore leave them out.
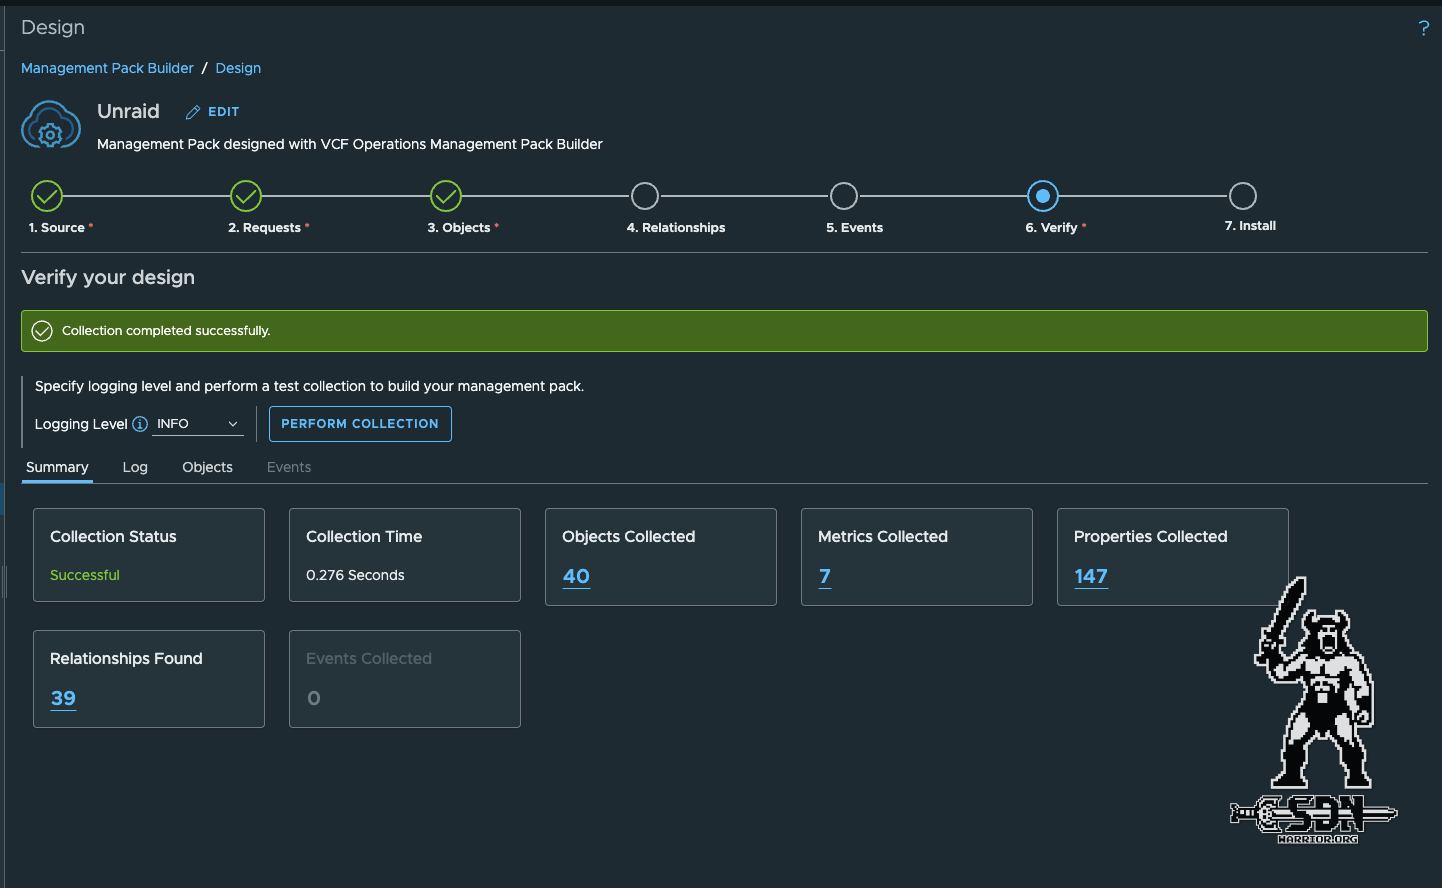
Verify (click to enlarge)
Congratulations, we have now created our first objects and metrics definition.
Side quest: Incompatible APIs, or rather, what to do when I need a metric but only get properties.
Well, friends, I had this problem with the OPNSense API. I can create objects perfectly well using the method described, but the API only returns a string with, for example, 6.7 ms for the latency. The Management Pack Builder can only interpret this as a string because of the unit that is attached, which means I can’t use it for calculations or to display a metric history, for example. But there is a solution.
FastAPI + Phyton = beautiful metrics
What is FastAPI? FastAPI was created to build type-safe REST APIs quickly and easily with Python. I use uvicorn as a fast and lightweight web server. I did the development in PyCharm. The tool runs on my system as a docker. In PyCharm, I created a new project and created exactly two files: requirements.txt and my actual proxy.py. The required libraries are listed in requirements.txt.
requirements.txt:
fastapi
uvicorn[standard]
requests
proxy.py:
import os, re
import requests
from fastapi import FastAPI, Request, Response, HTTPException

UPSTREAM = os.environ.get("UPSTREAM_BASE", "https://xxx.xxx")
VERIFY_TLS = os.environ.get("VERIFY_TLS", "false").lower() == "true"
TIMEOUT = float(os.environ.get("TIMEOUT", "10"))

app = FastAPI()

_ms = re.compile(r"^\s*([0-9]+(?:\.[0-9]+)?)\s*ms\s*$", re.I)
_pct = re.compile(r"^\s*([0-9]+(?:\.[0-9]+)?)\s*%\s*$", re.I)

def parse_ms(v):
    m = _ms.match(v or "")
    return float(m.group(1)) if m else None

def parse_pct(v):
    m = _pct.match(v or "")
    return float(m.group(1)) if m else None

@app.get("/api/routing/settings/search_gateway")
def search_gateway(request: Request):
    auth = request.headers.get("authorization")
    if not auth:
        raise HTTPException(status_code=401, detail="Missing Authorization header")

    url = f"{UPSTREAM}/api/routing/settings/search_gateway"
    headers = {"Authorization": auth, "Accept": "application/json"}

    try:
        r = requests.get(url, headers=headers, timeout=TIMEOUT, verify=VERIFY_TLS)
    except requests.RequestException as e:
        raise HTTPException(status_code=502, detail=f"Upstream request failed: {e}")

    if r.status_code >= 400:
        return Response(
            content=r.text,
            status_code=r.status_code,
            media_type=r.headers.get("content-type", "text/plain"),
        )

    try:
        data = r.json()
    except ValueError:
        raise HTTPException(status_code=502, detail="Upstream returned invalid JSON")

    for row in data.get("rows", []):
        if isinstance(row.get("delay"), str):
            v = parse_ms(row["delay"])
            if v is not None:
                row["delay_ms"] = v

        if isinstance(row.get("stddev"), str):
            v = parse_ms(row["stddev"])
            if v is not None:
                row["stddev_ms"] = v

        if isinstance(row.get("loss"), str):
            v = parse_pct(row["loss"])
            if v is not None:
                row["loss_pct"] = v

    return data
The whole thing is started in my development environment with uvicorn proxy:app –host 0.0.0.0 –port 666
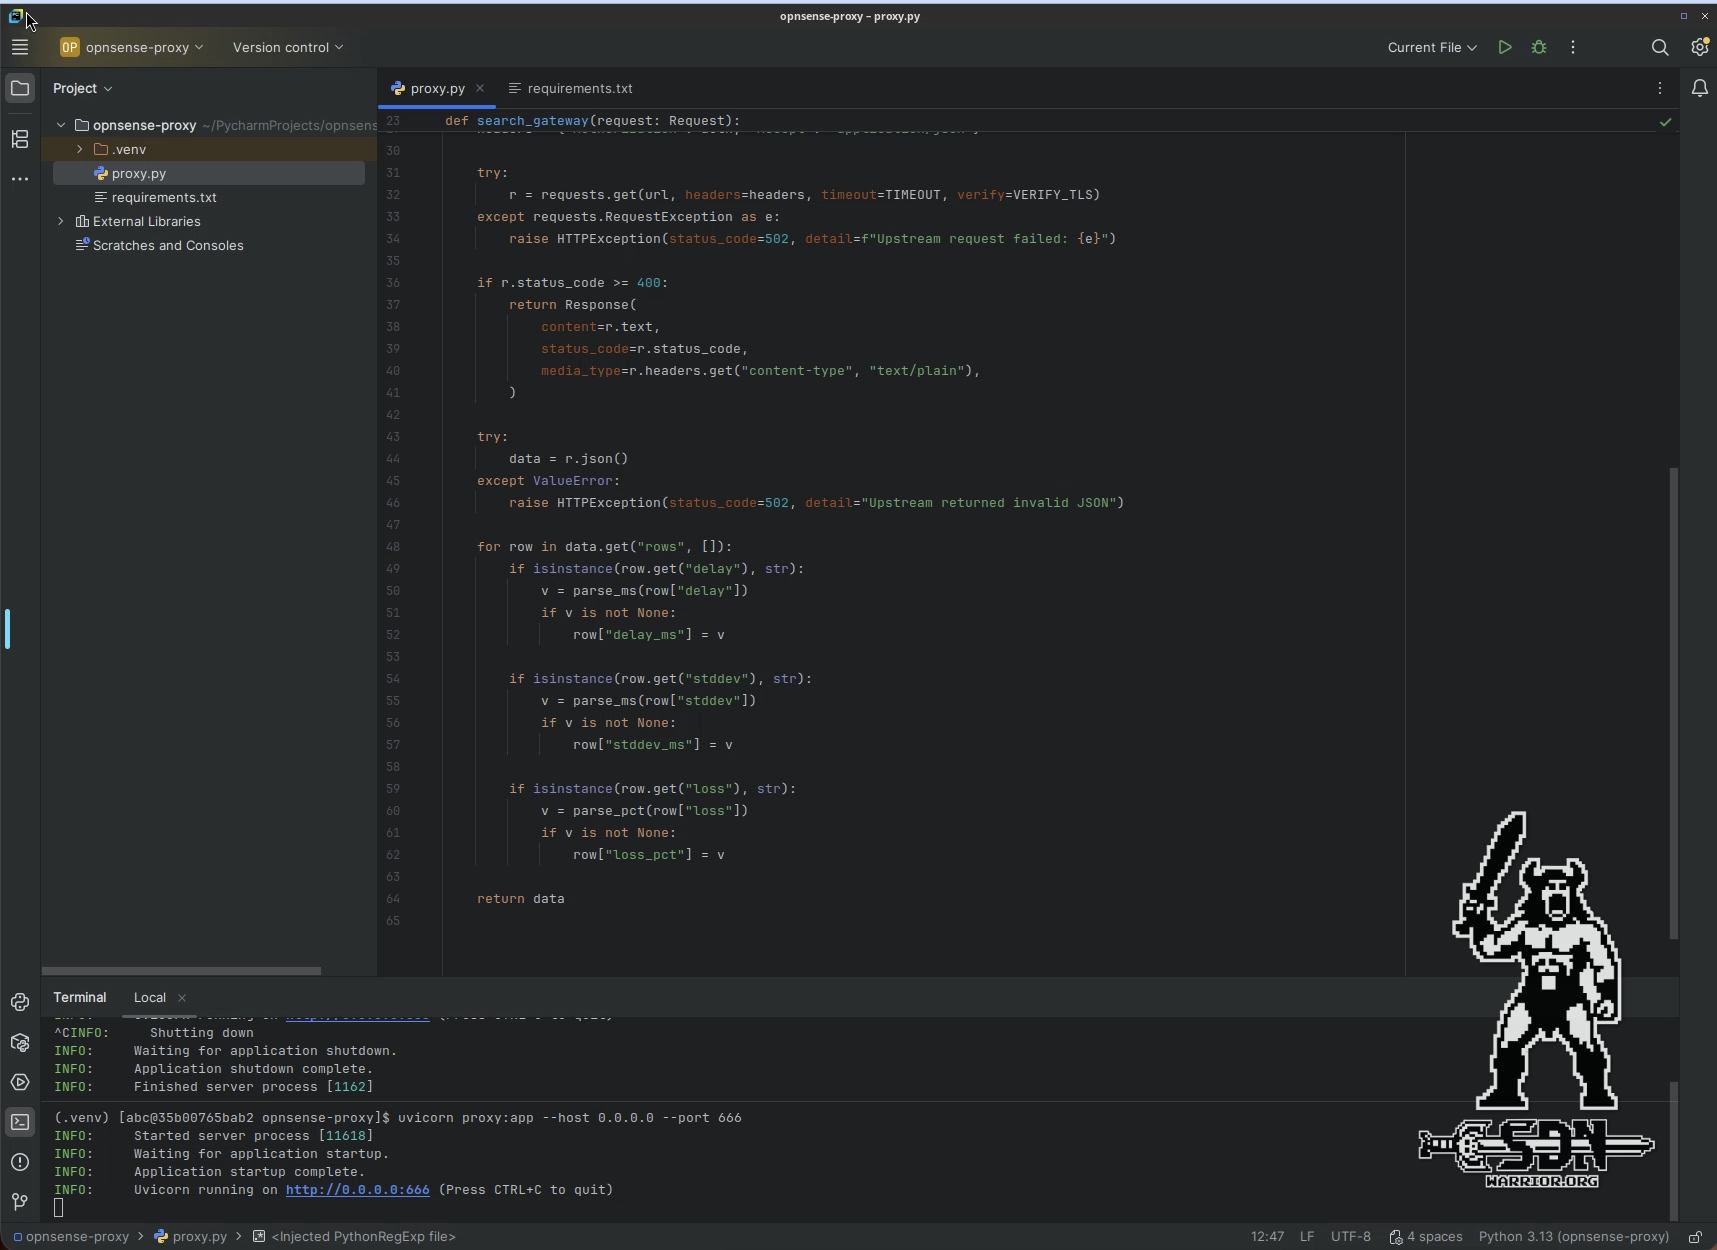
PyCharm (click to enlarge)
Of course, this is only intended for development purposes. Later, I built a Docker container from it that runs on my Unraid server, is backed up, and also starts automatically. It is important to note that authentication is not touched and is simply passed on. In Python, I parse the values for delay, stddev, and loss and remove the units. However, I keep the original values and simply output additional values that do not have units. FastAPI thus serves as an API proxy, and I no longer address my OPNSense directly, but rather the FastAPI Docker container, which then returns a usable API to me.
But back to the actual topic.
Building Dashboards
I now have my object definitions, and in order to actually receive data, I need to create an account under Administration -> Integrations. Unraid (the created management pack) is now also available as an account type, and I need to enter the data for the API here. Host name, collector, port, SSL configuration, and so on.
To view my objects now, you can find them under Inventory -> Integrations. The object type UPSLoad that I created can be found in the Unraid integration. If the API returned more than one UPS here, there would be two objects of the object type UPSload. Within the object, you can find the queried values in the Metric Power Load Percentage. It takes at least 5 minutes for the first values to appear.
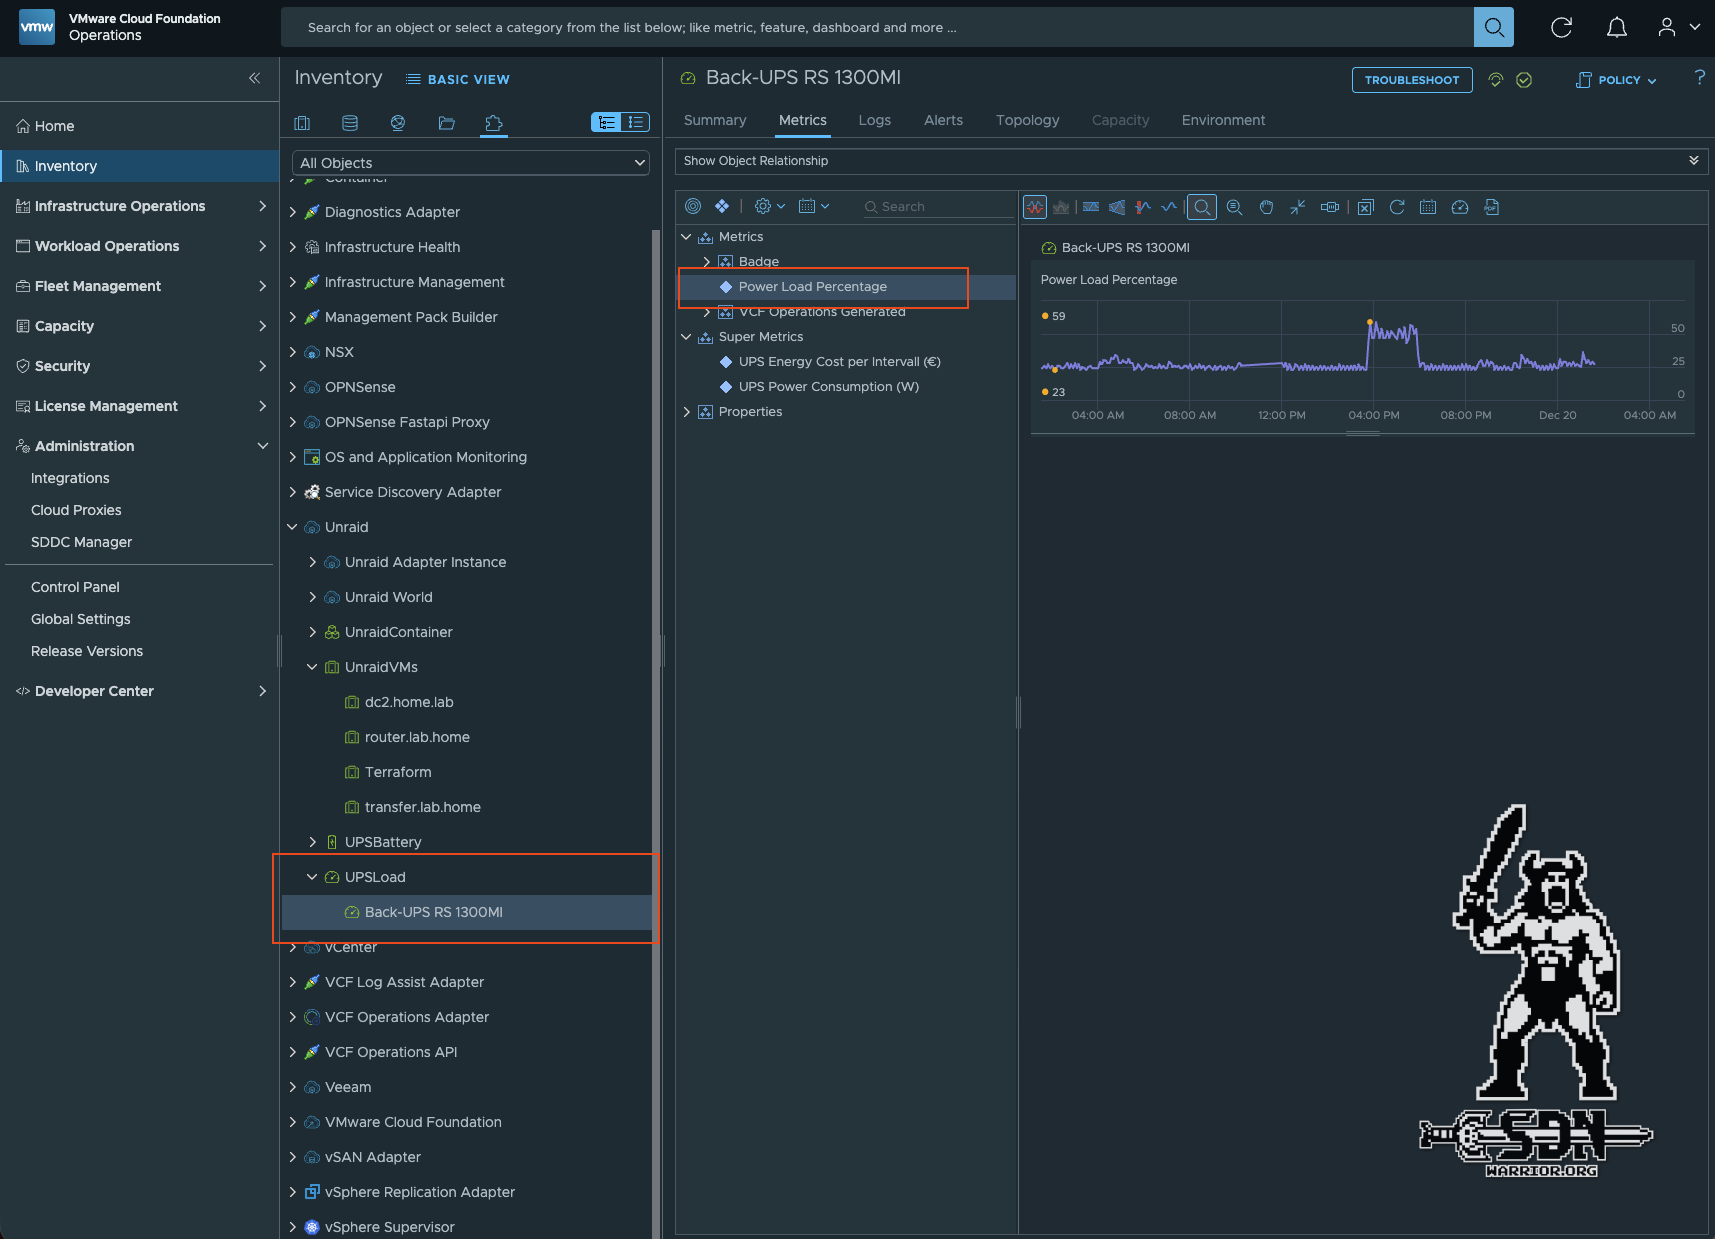
UPS Object (click to enlarge)
You can now work with these values. However, I only have a percentage value and I would prefer to see the watts displayed, because I can imagine more under 300 watts than under 34% usage. But how does that work?
Super Metrics
Super metrics are values that can be calculated using other metrics. You can also use super metrics for super metrics. However, it is important to remember that the source metric must be available before the super metric can be calculated. It is also important that the super metric is assigned to the correct object type. In my case, the object type is UPSLoad.
A Super Metric must also be assigned to a policy. If this is forgotten, there will be no values. I use the default policy that is used for every object here. However, you could also write a specific policy.
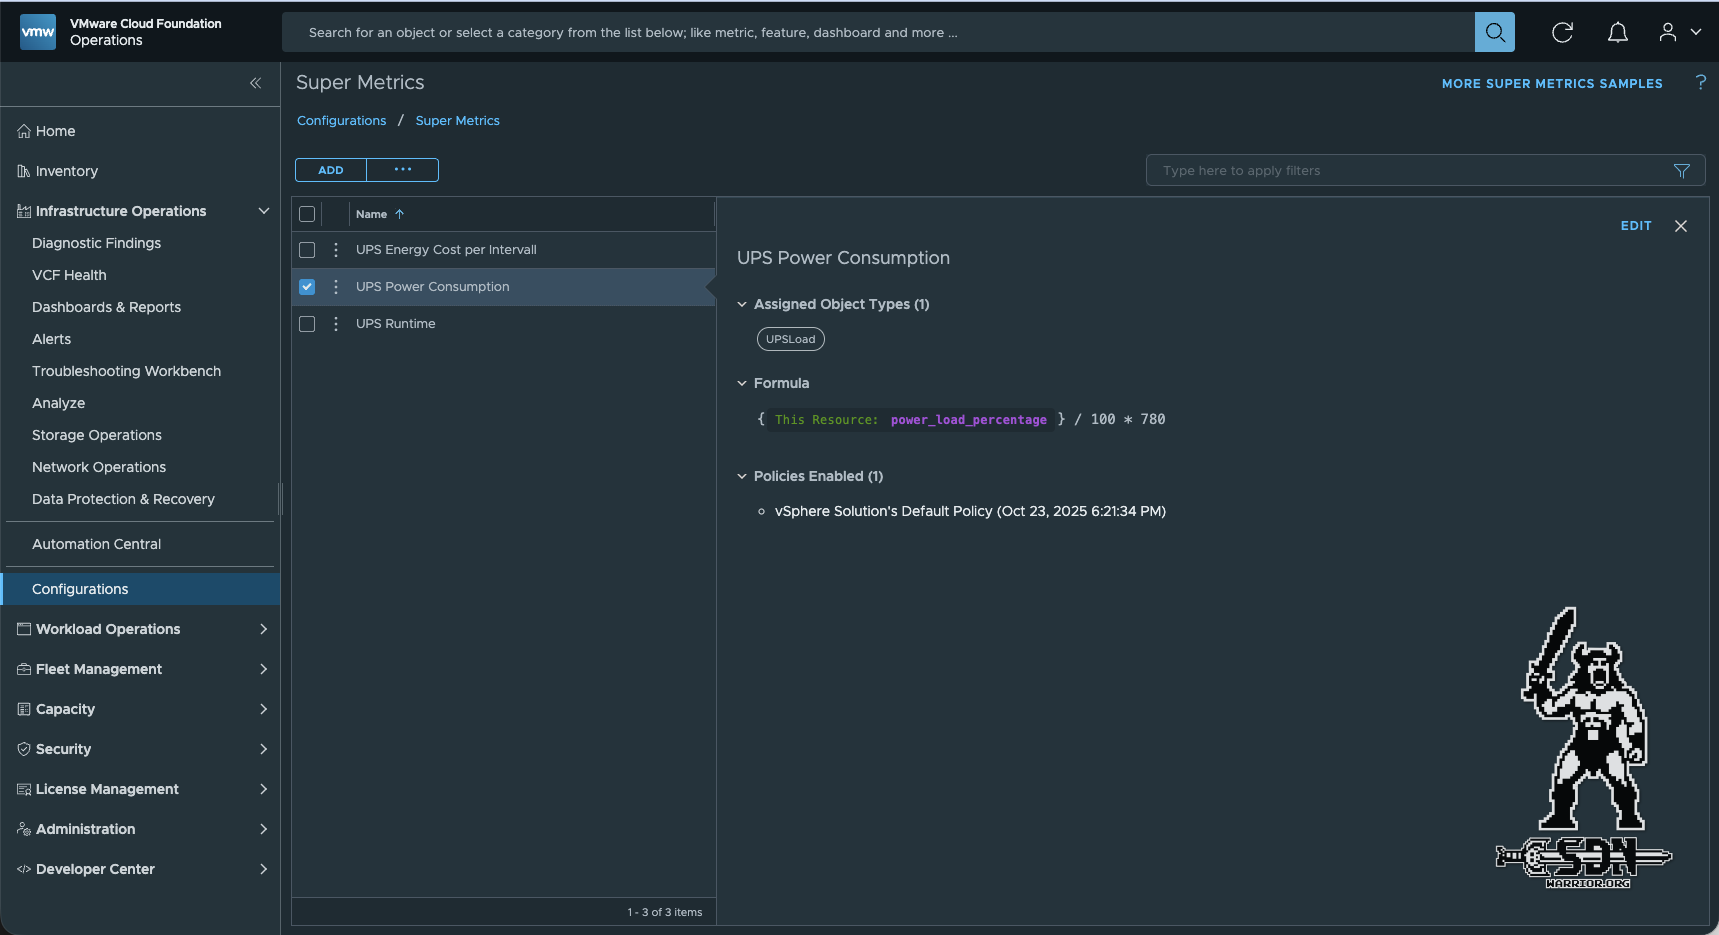
Super Metrics (click to enlarge)
The rest is simple math. Since I know the maximum power of the UPS, i.e., how many watts 100% is, I can easily convert the percentage into watts.
After 1-2 intervals have passed, the Super Metric is displayed in the object and can be used. This can be checked via Inventory.
Building the Dashboard
Now that the basics are done and the first objects are appearing in Operations, I can start building a dashboard. A new dashboard can be created under Infrastructure Operations -> Dashboards & Reports. There are quite a few widgets available for displaying various metrics. For watts, a metric chart is useful, as it can show consumption over a certain period of time. Each widget has a refresh counter (which only determines the interval at which the widget is updated, not the object). Another important option is Self Provider. On means the widget is independent of other widgets. It does not take input from other widgets, hence it requires input to be configured in the widget itself.
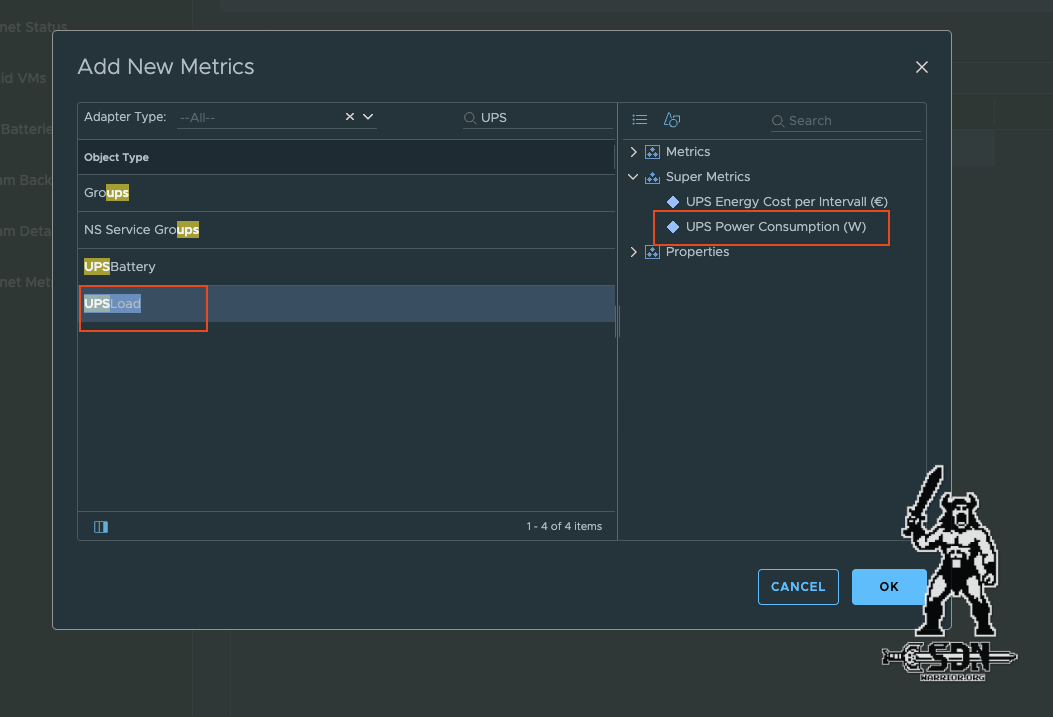
Output Data (click to enlarge)
Under Input Data, you can choose whether you want to have a complete object (or several) as input or just metrics. If I take the object as input, I can also display properties. The actual output of the widget is then configured under Output Data. Input and output must match. If I select an object as input that is not of the same object type as my output metric, no content will be displayed.
The finished widget now looks something like this.
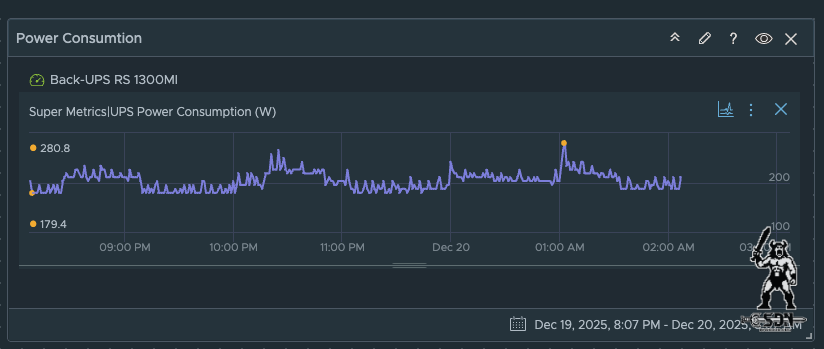
Widget (click to enlarge)
It wasn’t that difficult, and now all the basics are in place to build a nice dashboard. Of course, there’s a lot more you can do, such as symptom definitions that trigger something when certain metrics occur or properties change. For example, I wrote a symptom definition that reduces the health value of a Veeam object if the backup status is not successful. This also triggers an alarm.
But I think I’d rather write about that separately, because it’s a topic in its own right. The same goes for the Health Metric, which automatically assigns operations to each object.
My final dashboard now looks like this.
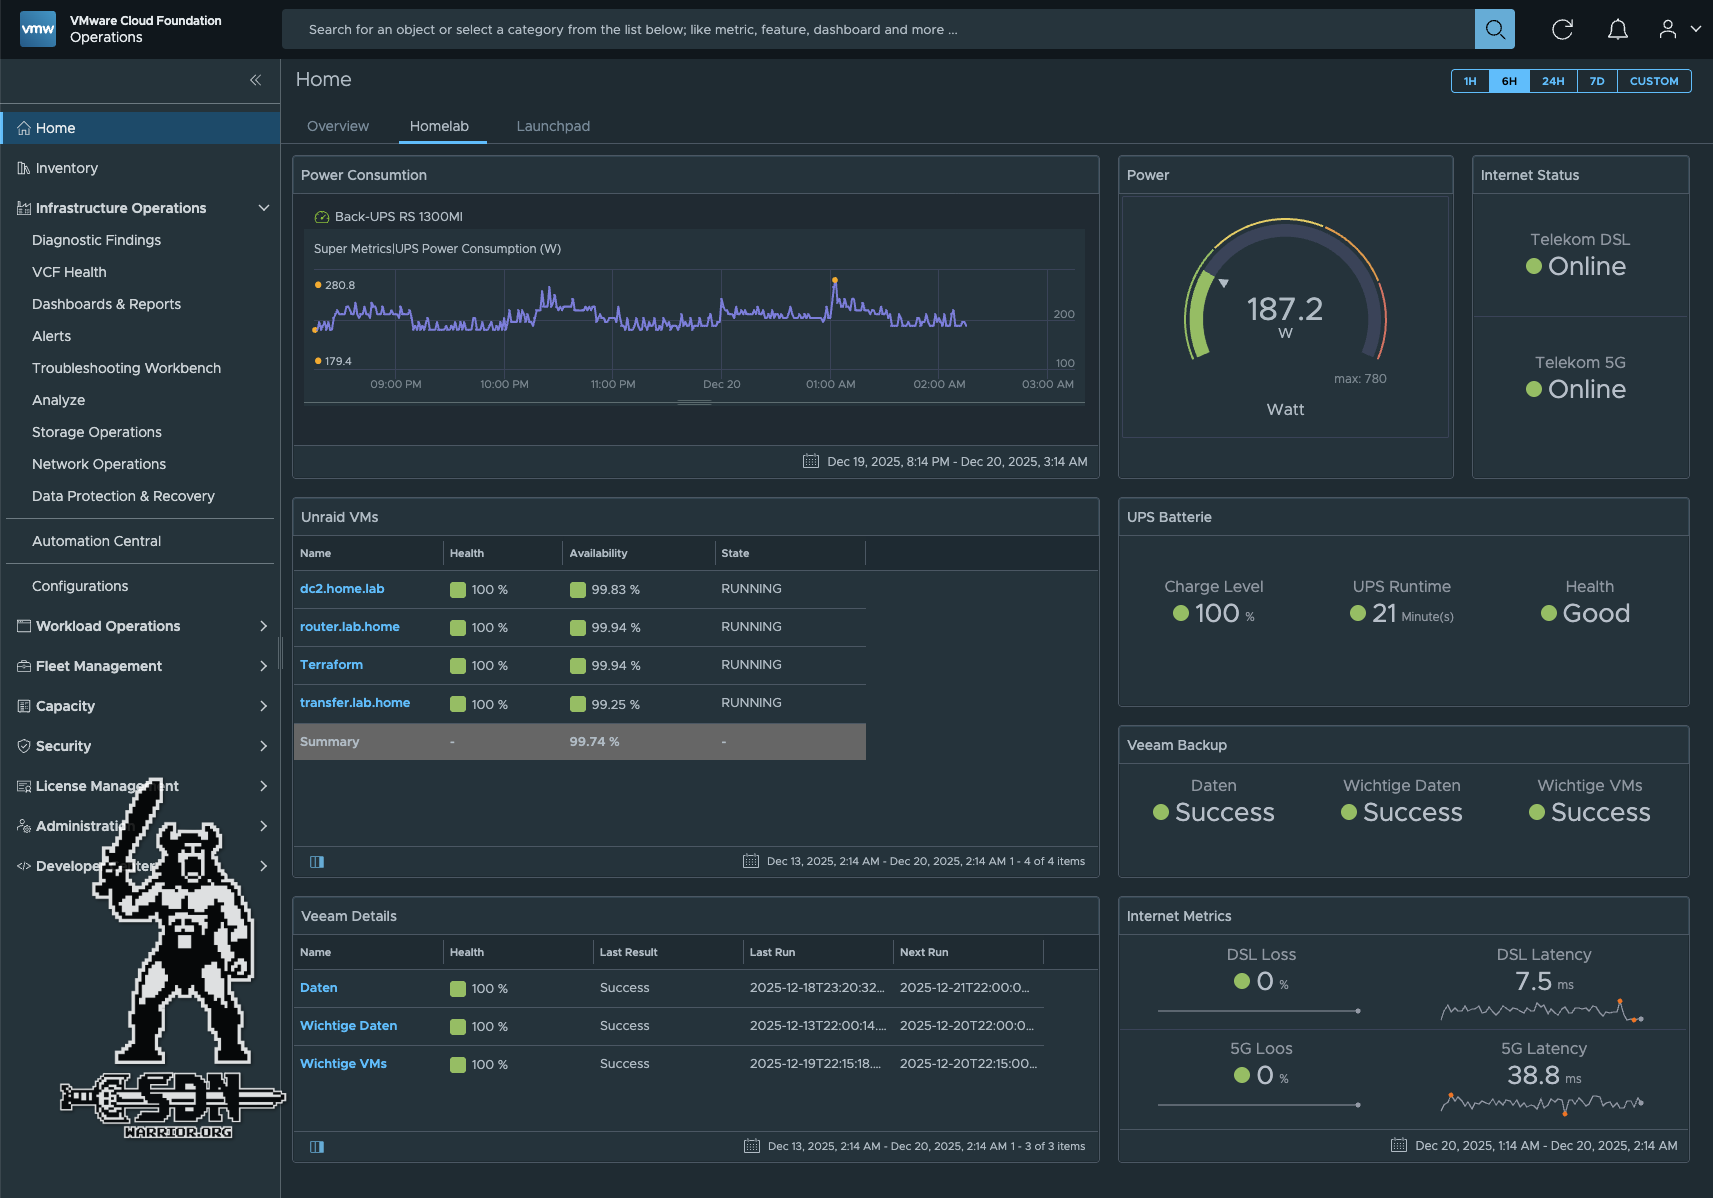
Final Dashboard (click to enlarge)
Side Quest - Bearer Token
The Veeam API uses bearer tokens with limited runtime, which means that an API request must first be created with a username and password to generate a token before a request to retrieve data can be made. Fortunately, the Management Pack Builder also supports this, but it’s all a bit fiddly, so I’ll describe it here. For Veeam to work, authentication in the Data Source Connection must be set to Custom, otherwise we will not be able to create a secure variable. It is also important to enable Use Session Authentication.
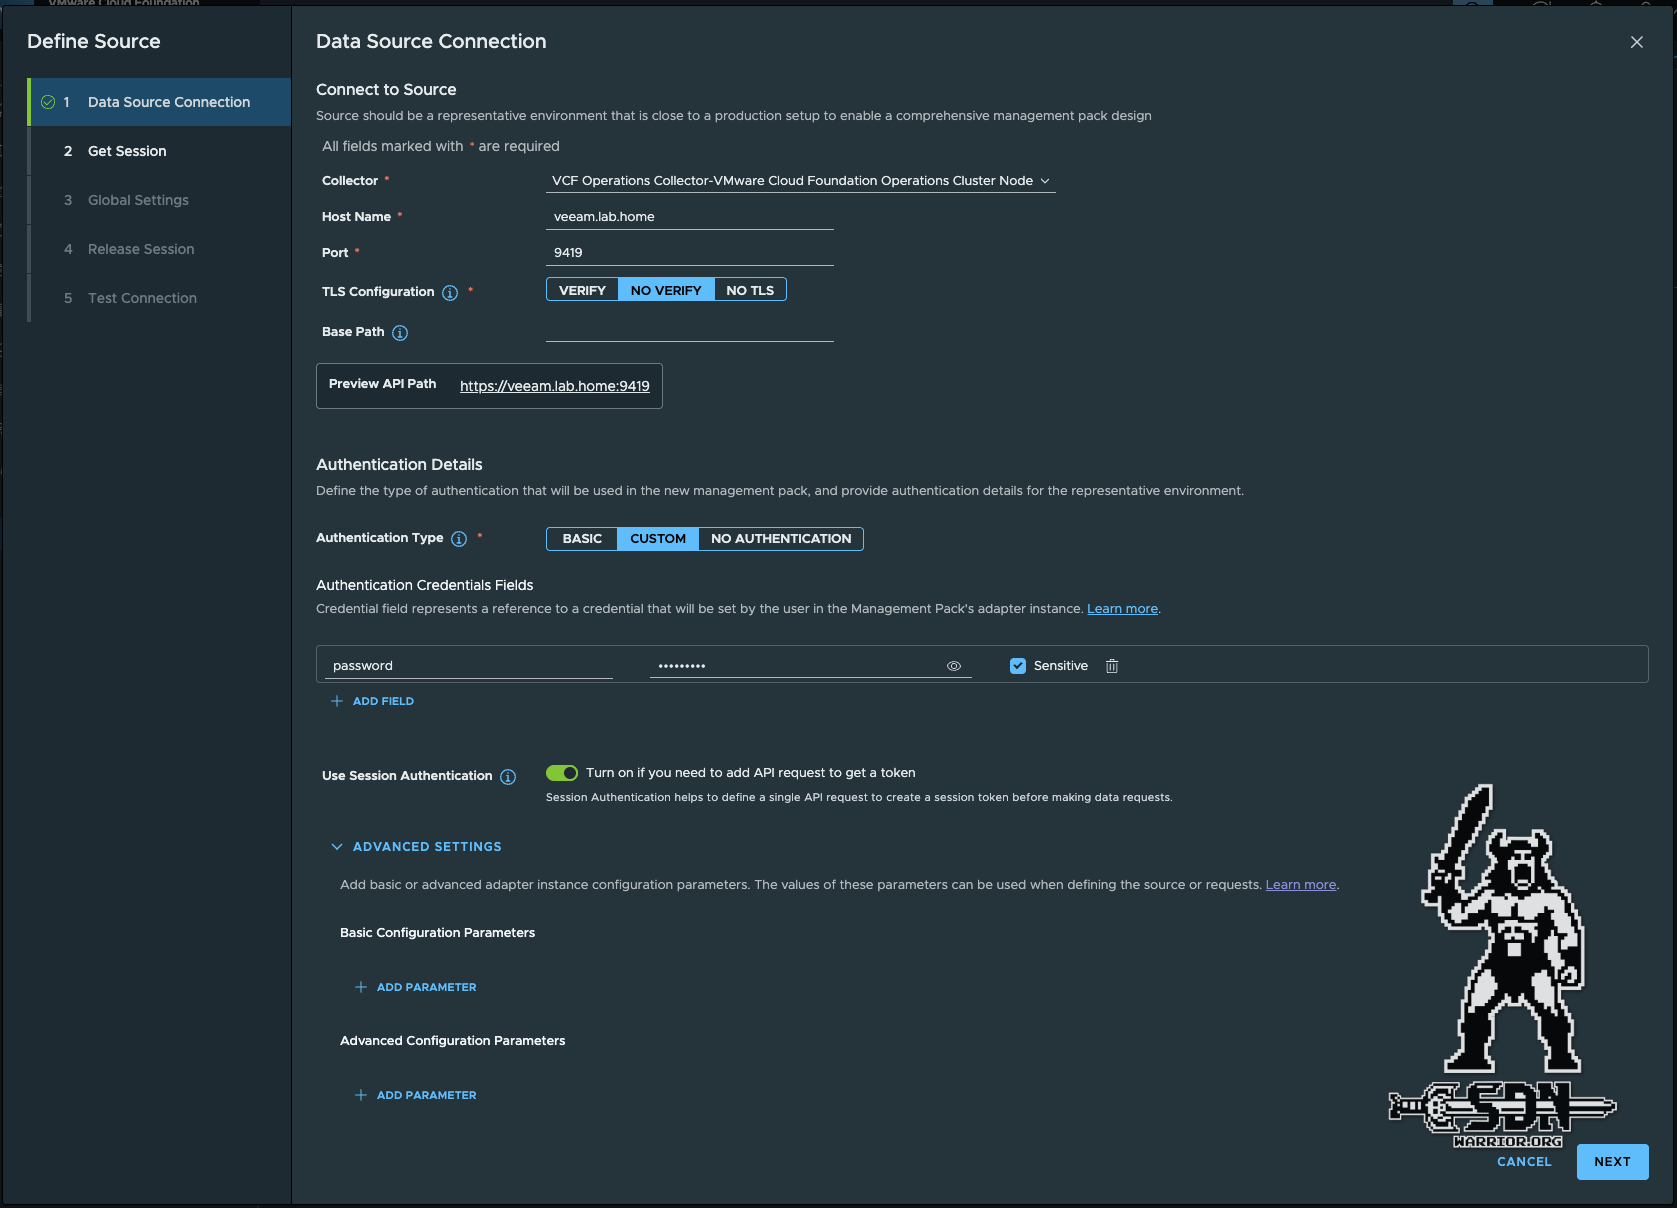
Veeam (click to enlarge)
From here on, things change slightly, as we now have to perform two requests. It is also important to note that the username and password must be included in the body for Veeam. A variable is also used for the password here. From here on, things change slightly, as we now have to perform two requests. It is also important to note that Veeam also requires special headers. However, as Veeam uses Swagger, you can extract all of this information from there.
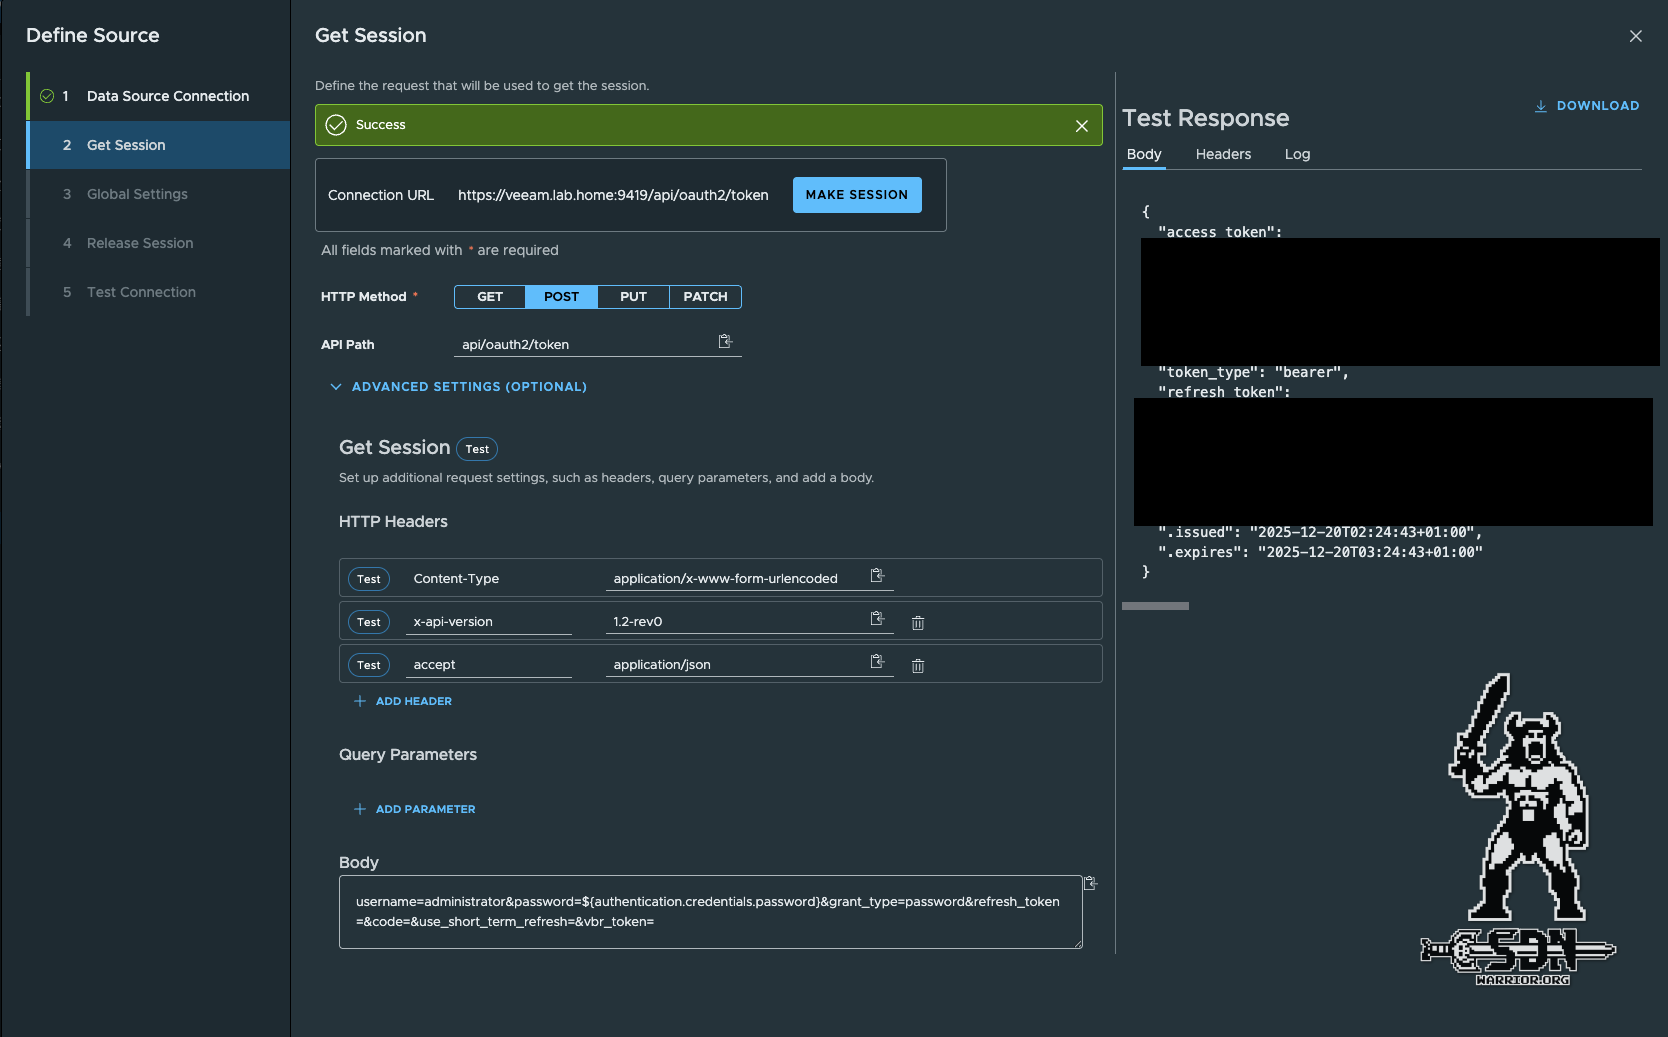
Veeam Session (click to enlarge)
After successfully creating a session, we can now see the token under Global Settings in Session Fields. Session Fields are automatic variables that must be used for the Test Connection and also for the Release Session request. We don’t need to change anything in Global Settings, and since I didn’t want to censor another screenshot, I decided not to bother.
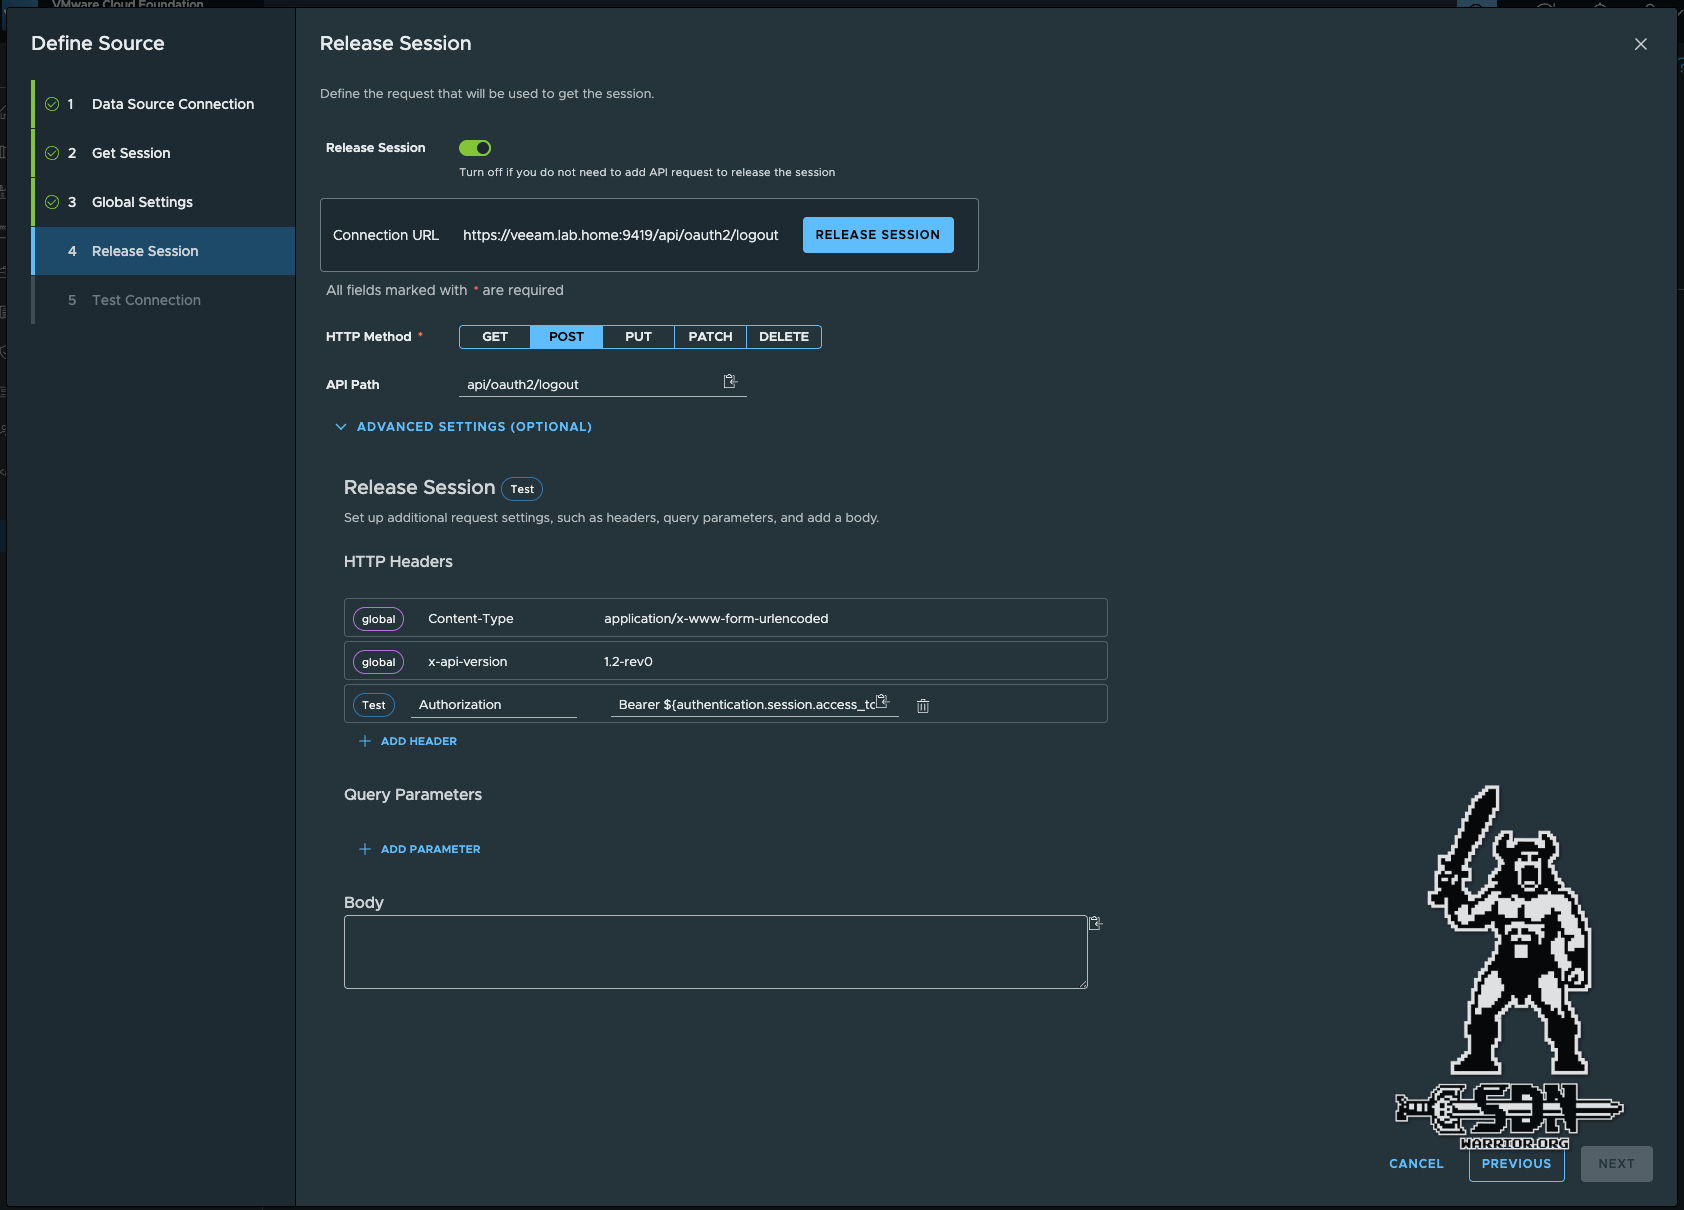
Release Session (click to enlarge)
A release session request is nothing more than a logout command, after which the data is retrieved. This should be used to ensure that the session is closed properly.
As a final step, a test connection must be performed so that the DataSource can be saved. I simply queried the session information for this, but ultimately it doesn’t matter what is queried here as long as a valid result is returned.
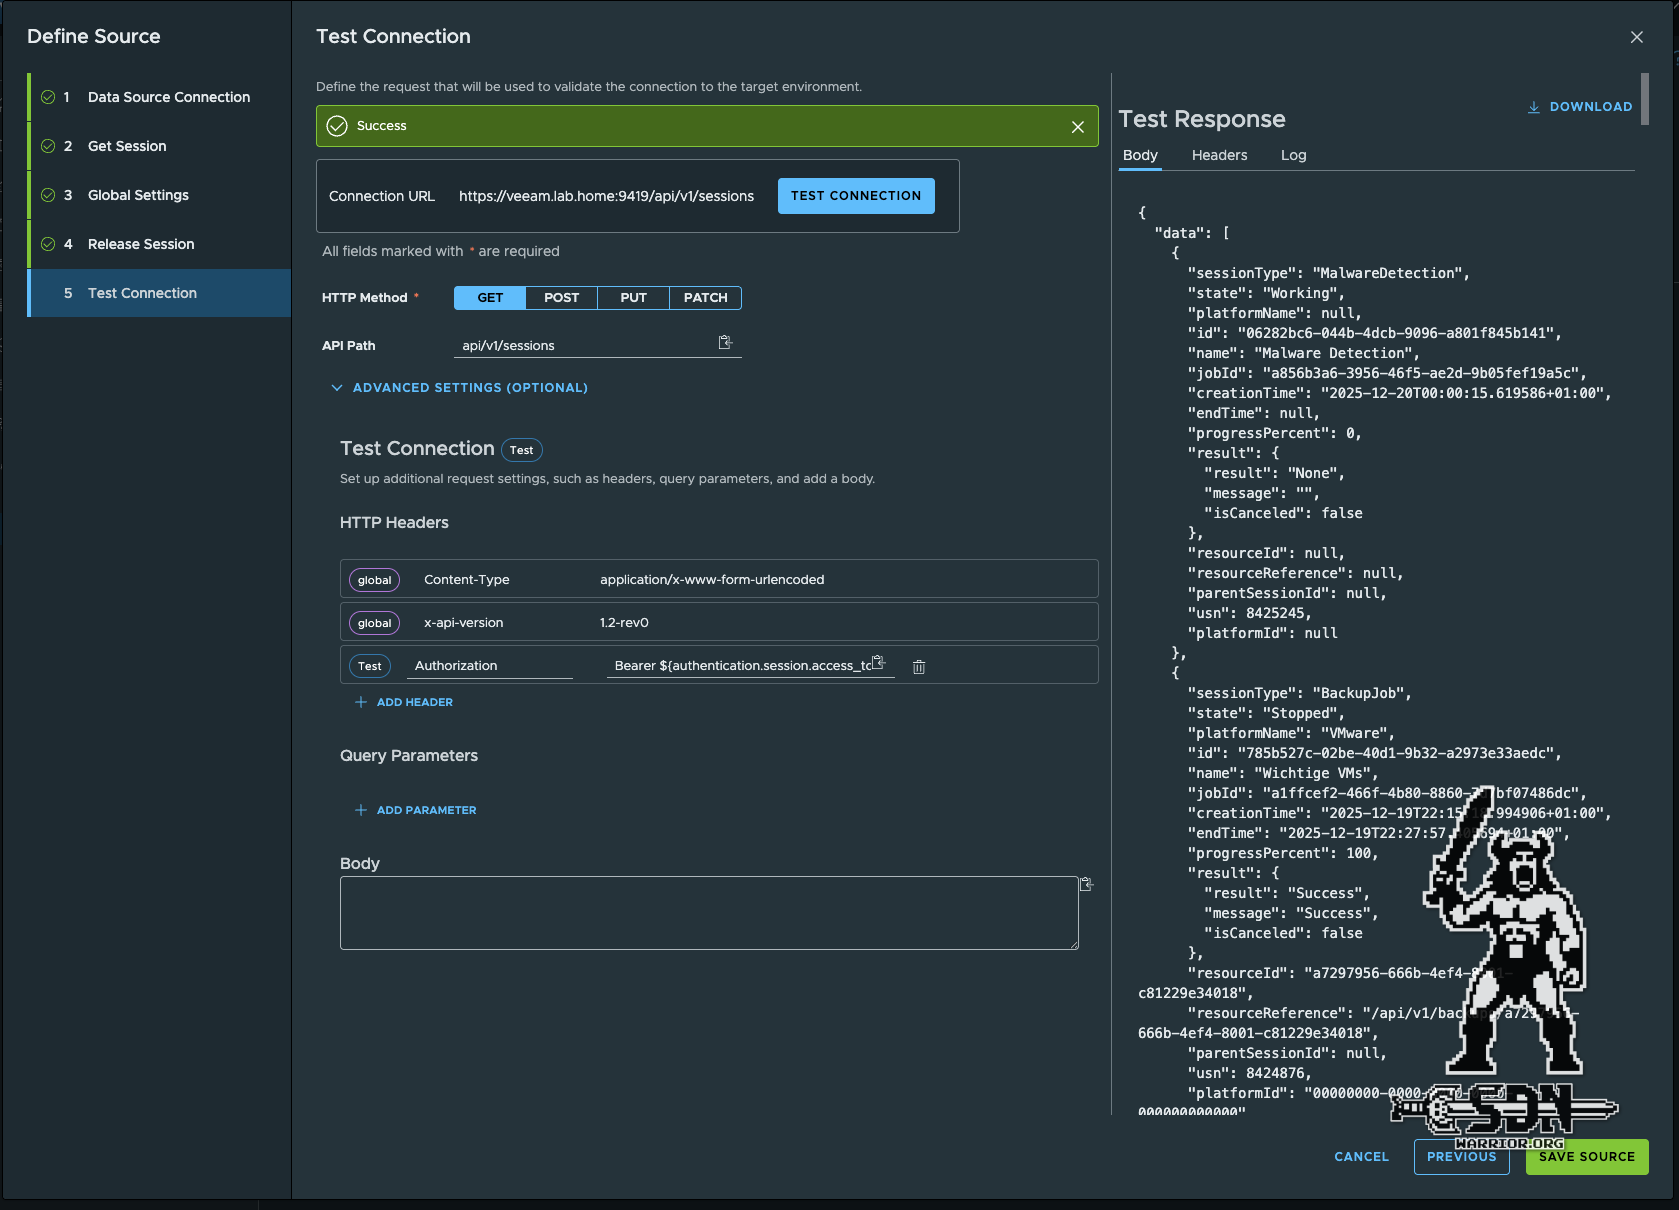
Final Test (click to enlarge)
If the data source is set up in this way, the Management Pack is also secure for export, as no credentials are stored. When integrating into Operations, the username and password must then be provided. The session is created, the token is generated, and the session is closed cleanly with each data retrieval cycle. Everything else is exactly the same as previously described for the Unraid API.
Summary
VCF Operations is a powerful tool, albeit a little outdated in some areas, particularly when it comes to handling APIs, where you can still see the product’s roots and age. Nevertheless, with a little work, Operations can be expanded wonderfully to monitor more than just the VMware environment. If you want, you can build a weather report into the dashboard – why not?
Of course, this article only scratches the surface; we haven’t talked about views yet, or how the whole Alarming works, or how to work with colors, and so on. Considering that it’s already almost 3 a.m. and the topic is so extensive, I’ll write a more in-depth article if there’s interest. I hope I’ve been able to help you make even better use of your operations.
Looking at my final dashboard, I’m quite excited about how much you can achieve with it in a short amount of time. I only looked into the topic about a week ago and have been cautiously playing around with it. My thanks also go to Dale Hassinger, who was kind enough to help me. Check out his blog.
And now all that remains for me to say is, happy creating and Merry Christmas!
