Intel Optane on Nutanix CE - Or I should have read the manual
This short blog post is meant to show that things don't always work out and that sometimes, in the world of home labs, you're just throwing money down the drain.
4188 Words // ReadTime 19 Minutes, 2 Seconds
2026-07-29 01:00 +0200
Introduction
I’m not quite sure how to start—maybe with a brief statement and a little foreshadowing. It doesn’t always work out when you set your mind on something, and it’s not always the software’s fault. So this post isn’t meant to bash Nutanix, but it’s intended to prevent people from making the same mistakes I did.
But let’s take it slow and start from the beginning. What was I actually planning to do? A few weeks ago, I bought some Intel Optane drives on eBay for my VCF setup to use them as memory tiering devices. The drive just needs to be fast, have low latency, and deliver solid random IOPS. You can currently find 280 GB Intel Optane 900P cards on eBay at a pretty good price. The cards cost around 160 euros, give or take a few euros, plus shipping—and since they come from China, there’s also a bit of customs duty. Long story short, the drives have proven themselves in memory tiering, which is why I thought, “Why not use them for Nutanix?” Since they work very well with VMware Memory Tiering and vSAN OSA — what could possibly go wrong?
Intel Optane
Intel Optane SSDs such as the 900P are PCIe/NVMe drives built around 3D XPoint storage technology developed by Intel and Micron. 3D XPoint stores bits by changing the resistance state of the memory cell in a transistor-less cross-point array. Don’t ask me exactly how it works - maybe black magic.
But what I do know is that Optane drives are characterized by tremendous durability, low latency, and, above all, consistent read/write performance. Unlike many consumer NAND SSDs, they do not depend on a small SLC write cache, so there is no dramatic performance cliff once that cache is exhausted. In my tests, I was able to fill the entire drive to its maximum capacity without any loss of performance. This is also consistent with Intel’s tests, which can still be found online. Unfortunately, Optane was discontinued in 2022.
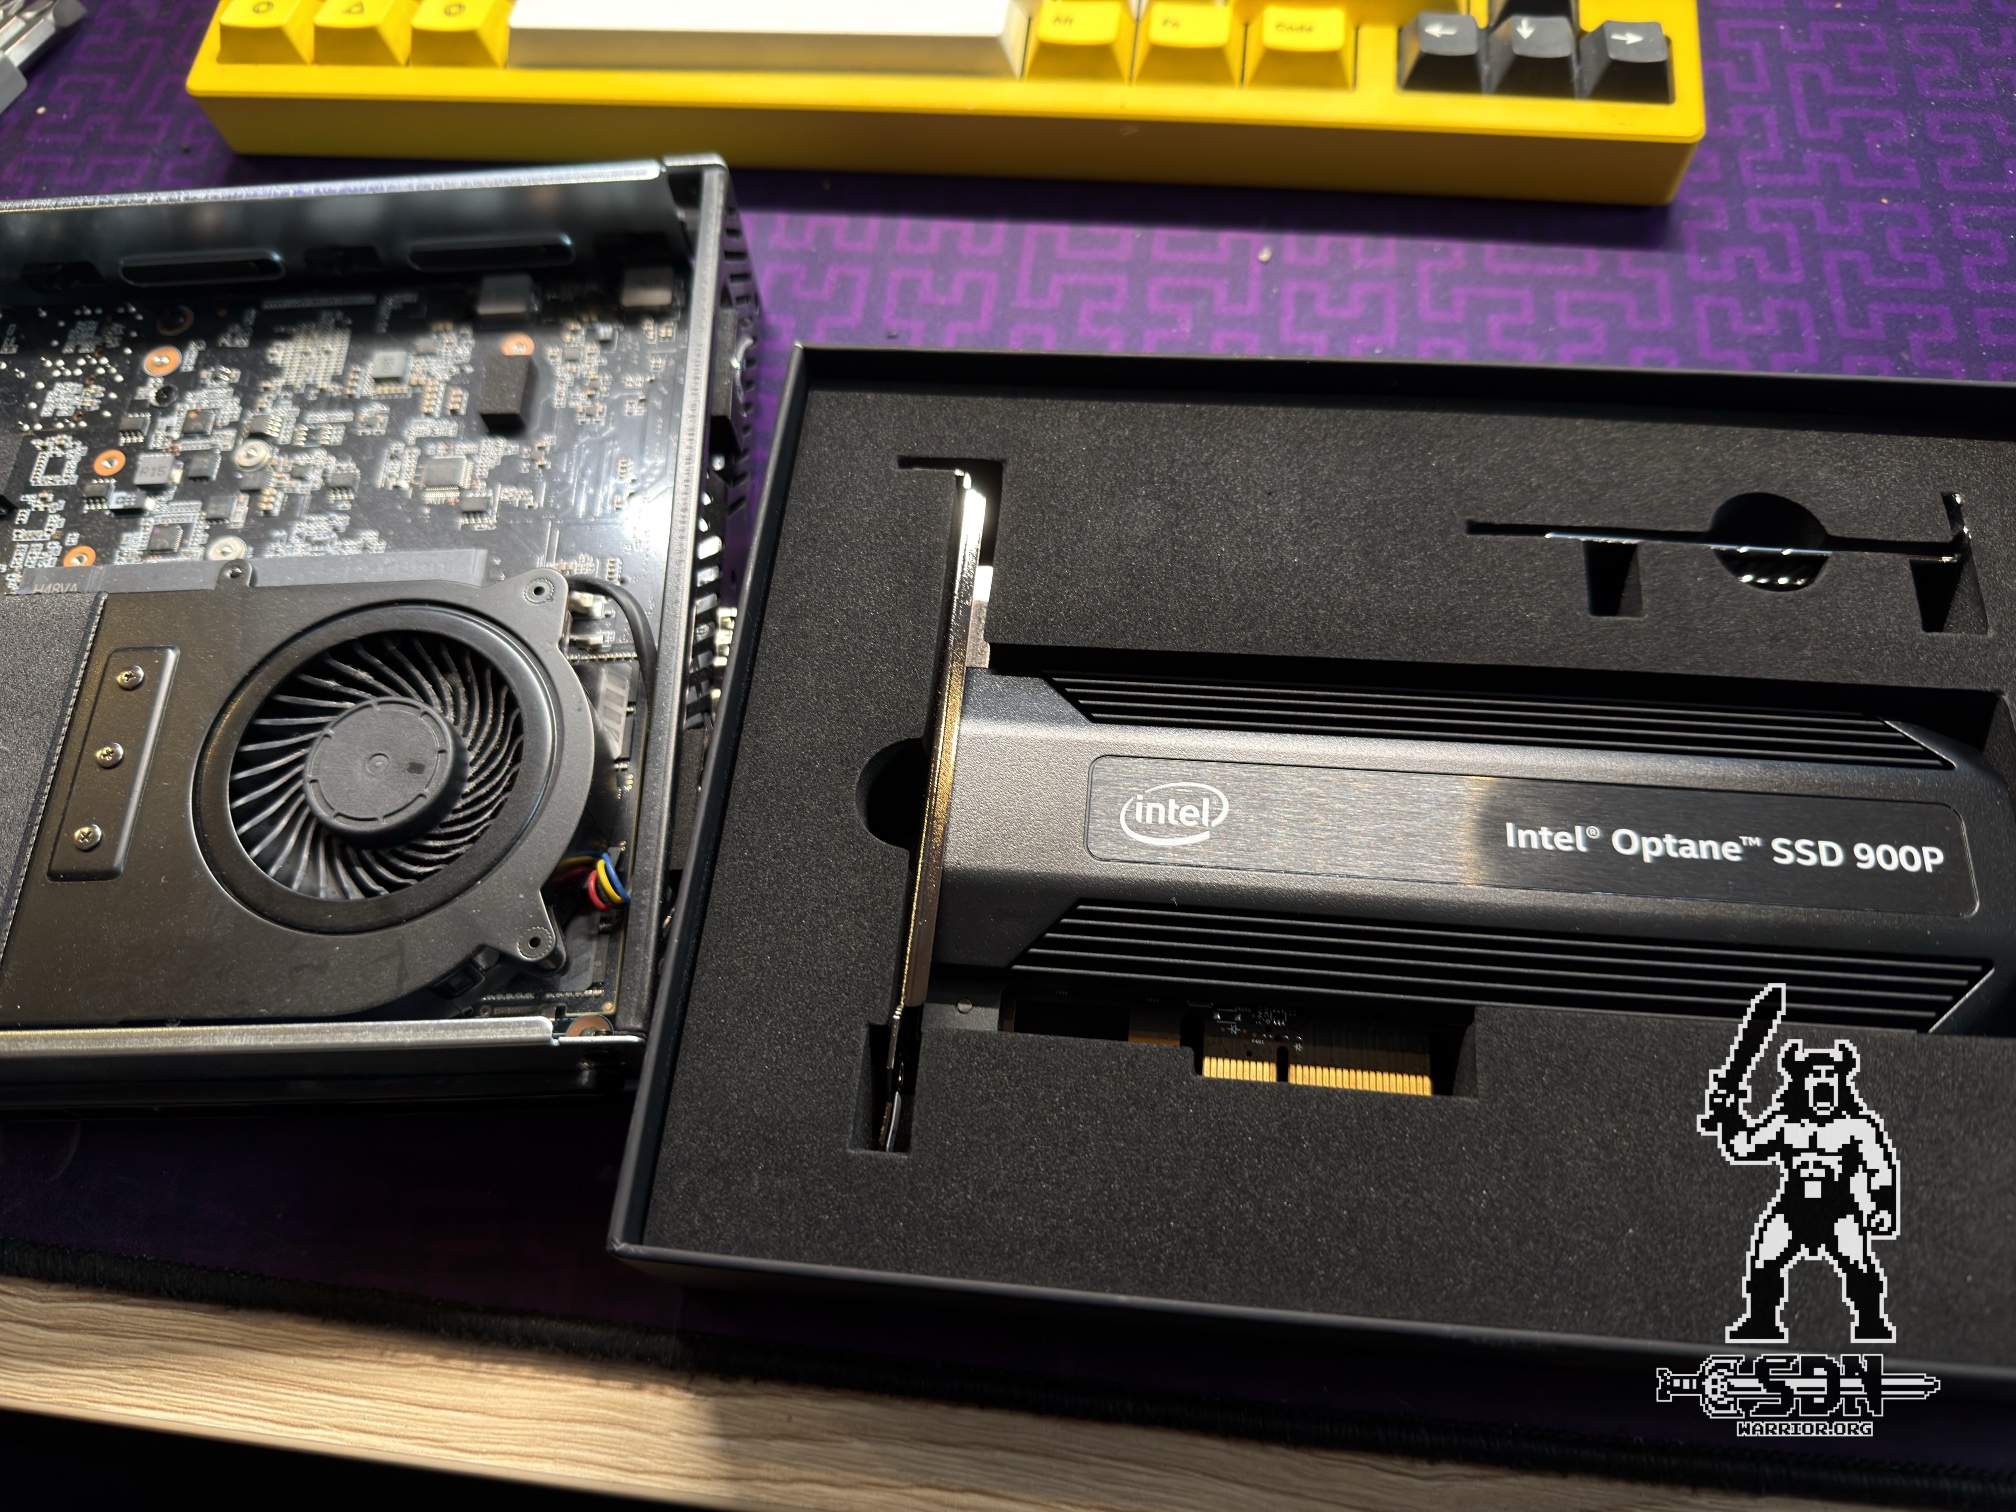
It’s also important to distinguish between consumer and enterprise Optane drives. The 900P was positioned as a client and enthusiast SSD, while enterprise models offered additional features such as enhanced power-loss protection and end-to-end data protection. Although the 900P falls into the consumer category, in terms of IOPS for random read and write operations, latency, and lifespan, it outperforms every other consumer NVMe drive I’ve ever used.
The Idea
My idea was simple, more or less. Using Intel Optane as a dedicated CVM and performance-tier device in a Nutanix CE node was intended to reduce storage latency, improve performance for random and mixed I/O operations, and ensure more consistent write behavior under sustained load. That’s how simple and straightforward my thinking was.
Stargate I/O Logic
This is where my first mistake comes in, because Nutanix AOS storage architecture simply works differently than vSAN OSA. With OSA, all writes are first written to the caching device and then destaged to the other tier. An Optane drive can be very helpful here.
With Nutanix, it depends heavily on the type of writes. Sequential writes typically bypass OpLog and are written directly to the data disks (Extent Store). Random write operations in bursts typically end up in the OpLog. Sustained random writes, like sequential writes, can go directly to the Extent Store or the OpLog. Reads are served either from Unified Cache (RAM), the OpLog or the Extent Store, depending on where the data is currently located. Yes, I realize that this is a very simplified explanation, but storage isn’t my main focus anyway. Otherwise, this article probably would never have been written.
But how did we get to this point? Well, the easiest way to start is with the setup.
The setup
I’m using my 3-node cluster with Minisforum MS-01 nodes, configured with 2x10 Gb/s networks in an LACP bond with jumbo frames, 96 GB of RAM, and a total of 3 NVMe drives per node + Intel 900P. My CVMs each had 24 GB of RAM, which means that approximately 5.4 GB of Unified Cache is available ((CVM Memory - 12 GB) * 0.45). In addition, the cluster was deployed with the default redundancy factor of 2.
| NVMe Model | Capacity | Usage |
|---|---|---|
| Intel Optane SSD 900P | 280 GB | CVM and performance tier in the Optane configuration; raw-device target for the native FIO benchmark; not used in the baseline setup |
| Samsung SSD 990 PRO | 2 TB | Nutanix data tier |
| Lexar SSD EQ790 | 2 TB | used for CVM-related and storage partitions |
| Lexar SSD EQ790 | 1 TB | AHV boot device; Ubuntu system disk during the native Optane benchmark |
My cluster is based on the CE version of Nutanix, but I have updated it to the current latest versions of AHV 11.2, AOS 7.6, Prism Central 7.6, and so on. To run the performance test, I created an Ubuntu server VM and placed it to an empty AHV host. I also shut down all workload VMs except for the Prism Central VM so as not to influence the results.
Test VM Configuration
| Component | Configuration |
|---|---|
| Operating System | Ubuntu 26.04 LTS |
| Kernel | Linux 7.0.0-28-generic |
| Architecture | x86_64 |
| FIO Version | fio 3.41 |
| System Disk | 32 GiB virtual disk |
| Test Disks | 2 × 100 GiB virtual disks |
| Guest RAID Layout | Linux software RAID1 |
| RAID Device | /dev/md0 |
| Usable Test Capacity | Approximately 99.9 GiB |
| Filesystem | XFS |
| Mount Point | /mnt/fio |
| Test File | /mnt/fio/testfile-64g |
| Test File Size | 64 GiB |
| I/O Engine | libaio |
| Direct I/O | Enabled with direct=1 |
| Number of Jobs | 1 |
| Virtualization Platform | Nutanix AHV |
| Storage Path | Guest XFS → Linux md RAID1 → 2 virtual disks → AHV → CVM/AOS → Nutanix storage |
| vCPU Allocation | 4 |
| Memory Allocation | 8 GB |
RAID1 was used to generate higher backend I/O load from a single test VM. By mirroring each write operation to two virtual disks, multiple virtual hard disk queues are utilized, increasing the load on AHV, CVM, AOS, replication, and the physical storage paths without requiring multiple benchmark VMs to run simultaneously. This configuration does not fully replicate a multi-VM workload, as all I/O originates from a single guest and a coordinated FIO workload. However, the tests were conducted under similar conditions as much as possible and are internally consistent. Of course, the overall storage layout is different with an Optane disk than without one, and the cluster also had to be redeployed; however, I brought it up to the same patch level and configured it with the same settings. The reader should be aware that RAID 1 also affects the overall figures. Although it was kept constant across both tests, it amplifies the write path and may also amplify differences in data placement and replication behavior.
FIO Test Methodology
My FIO profile includes sequential throughput, random I/O operations with high queue depth, a 70:30 mixed synthetic workload, and latency at low queue depth. It is designed to measure both peak performance and latency behavior across the entire path. All tests accessed the same pre-created 64-GiB test file. The file was created before the benchmark began, and its expected size was verified. Nutanix compression and deduplication were disabled for all test runs. The same applies to erasure coding. In addition, the system had several hours to settle down before I ran the first tests. I’ve always run all tests on the same physical host.
The profile uses Linux’s native asynchronous I/O engine via libaio. Direct I/O is enabled with direct=1, which typically bypasses the Linux page cache within the guest operating system. Caches at other points in the memory path, such as the Nutanix Unified Cache, are not bypassed.
Before starting each workload, invalidate=1 instructs FIO to invalidate the guest operating system’s cached pages for the test file, if supported. This helps reduce the influence of the guest page cache.
The remaining global settings have the following purposes:
- numjobs=1 runs one FIO worker. Consequently, the configured I/O depth represents the total queue depth generated by the benchmark.
- group_reporting=1 produces combined reporting for all jobs in a reporting group. Since only one worker is used, this has little practical effect but keeps the output format consistent.
- refill_buffers=1 regenerates the I/O buffer contents for every submission instead of continually reusing the same memory buffer. This helps avoid repeatedly writing identical data patterns.
- randrepeat=1 initializes the random-number generators predictably, causing repeated test runs to use the same pseudo-random access pattern. This improves comparability but means that every run addresses blocks in the same sequence.
- percentile_list=50:95:99:99.9:99.99 records median and tail-latency percentiles in addition to average latency.
Sequential Throughput Tests
The sequential tests use 1 MiB blocks and an I/O depth of 16. Each test transfers exactly 64 GiB, covering the complete test file once. The result is relevant to workloads such as large-file reads, backup, restore, streaming, and sequential data processing.
High-Queue-Depth Random Tests
The random read and write tests use 4-KiB blocks, an I/O depth of 32, and an address range of 32 GiB. Both tests are time-based and run for 120 seconds following a 10-second warm-up phase. During the warm-up phase, FIO already generates the requested workload, but the resulting performance metrics are excluded from the reported statistics. Once the 32 GiB address range has been covered, FIO continues to perform I/O operations within the same range until the configured runtime has elapsed. The LFSR random number generator produces a deterministic pseudo-random access sequence that remains consistent across multiple runs.
Mixed 70/30 Workload
The mixed workload uses 8-KiB blocks with a target distribution of 70% read operations and 30% write operations. It runs for 180 seconds following a 10-second warm-up phase and takes place within an address range of 32 GiB. This synthetic workload is designed to illustrate how read and write operations compete for resources when executed simultaneously. It tests read caching, write persistence, replication, queue management, and the interaction between read and write traffic.
Low-Queue-Depth Latency Tests
The last two workloads use 4-KiB blocks and an I/O depth of one. They are designed to measure end-to-end storage latency with minimal queuing. After a five-second warm-up phase, each test runs for 60 seconds and accesses a 16 GiB address range.
Test Execution
The full FIO profile was run twice for each Nutanix storage configuration. There was a pause of at least 60 seconds between each run. The better result from the two runs is shown in the comparison tables. I determined which run was better based on the IOPS from each test. If a run had better IOPS in 4 out of 6 tests, that run was selected. The guest configuration, FIO profile, test file size, compression setting and deduplication setting remained unchanged between the baseline and Optane tests. However, the underlying Nutanix cluster had to be redeployed with a different physical disk layout for the Optane configuration. Therefore, the results represent a comparison of the two complete storage configurations.
Create a FIO test file
sudo fio \
  --name=prepare-64g \
  --filename=/mnt/fio/testfile-64g \
  --size=64G \
  --io_size=64G \
  --rw=write \
  --bs=1M \
  --ioengine=libaio \
  --direct=1 \
  --iodepth=32 \
  --numjobs=1 \
  --refill_buffers=1 \
  --end_fsync=1 \
  --group_reporting
FIO Test Profile
[global]
filename=/mnt/fio/testfile-64g
ioengine=libaio
direct=1
invalidate=1
refill_buffers=1
group_reporting=1
numjobs=1
randrepeat=1
percentile_list=50:95:99:99.9:99.99

[seq-read-1m]
rw=read
bs=1M
iodepth=16
size=64G
io_size=64G

[seq-write-1m]
stonewall
rw=write
bs=1M
iodepth=16
size=64G
io_size=64G
end_fsync=1

[rand-read-4k]
stonewall
rw=randread
bs=4k
iodepth=32
size=32G
time_based=1
runtime=120
ramp_time=10
random_generator=lfsr

[rand-write-4k]
stonewall
rw=randwrite
bs=4k
iodepth=32
size=32G
time_based=1
runtime=120
ramp_time=10
random_generator=lfsr
end_fsync=1

[mixed-70read-30write-8k]
stonewall
rw=randrw
rwmixread=70
bs=8k
iodepth=32
size=32G
time_based=1
runtime=180
ramp_time=10
random_generator=lfsr
end_fsync=1

[latency-read-4k-qd1]
stonewall
rw=randread
bs=4k
iodepth=1
size=16G
time_based=1
runtime=60
ramp_time=5
random_generator=lfsr

[latency-write-4k-qd1]
stonewall
rw=randwrite
bs=4k
iodepth=1
size=16G
time_based=1
runtime=60
ramp_time=5
random_generator=lfsr
end_fsync=1
Results without Optane drives
| FIO Test | Result | Average Latency | p99 Latency |
|---|---|---|---|
| Sequential Read 1 MiB | 2,587 MiB/s | 6.14 ms | 11.08 ms |
| Sequential Write 1 MiB | 1,704 MiB/s | 9.16 ms | 22.68 ms |
| Random Read 4K QD32 | 79,985 IOPS | 0.396 ms | 0.758 ms |
| Random Write 4K QD32 | 32,403 IOPS | 0.983 ms | 2.61 ms |
| Mixed 70/30 Read | 28,465 IOPS | 0.637 ms | 2.02 ms |
| Mixed 70/30 Write | 12,198 IOPS | 1.121 ms | 5.41 ms |
| Random Read 4K QD1 | 4,361 IOPS | 0.221 ms | 0.864 ms |
| Random Write 4K QD1 | 2,464 IOPS | 0.393 ms | 1.204 ms |
While the average latency simply represents the mean of all measured I/Os, the P99 latency indicates the time within which 99 percent of all I/Os were completed. When it comes to latency, the lower the better. A P99 latency that is close to the average latency indicates a storage system that operates consistently. The sequential write result is clearly below the read throughput, while the comparatively high P99 latency indicates less consistent completion times during the write workload.
Next up is the test with the Optane disks. However, I had to completely redeploy the cluster for this, because the Optane disks are too small to simply swap out. And honestly, I should have been suspicious at that point. But let’s dive in.
Re-provisioning the cluster for the Optane test
Let’s start with the first attempt: I wanted to use my 1 TB NVMe as the boot drive again, so I selected the Optane drive as the CVM drive and a 2 TB drive as the data drive. Unfortunately, this isn’t supported, and the installer keeps crashing unless the smallest drive in the system is used as the boot device. This issue has also been reported within the Nutanix community and appears to be a well-known problem with the CE Edition. I haven’t really found a solution to this yet, but I figured, “Oh well, let’s just run AHV from the USB drive.” These drives are 64 GB, so they’re technically the smaller drives. I was actually able to install Nutanix this way, but I couldn’t update it because the cluster check kept failing. But what exactly is wrong with my new deployment? After spending hours digging through the logs, I finally found the problem.
The cluster was unable to initialize “Curator” because the 280-GB Intel Optane drive was being used as the sole CVM drive. After the CVM system partitions were created, only about 139 GiB remained available for AOS. Curator required approximately 157 GiB for its MRFS reservation, so the drive was rejected as unusable and no Curator primary disk could be selected. Recreating the cluster did not help, as the underlying drive configuration remained unchanged.
So in the end, I had no choice but to use a second disk for the CVM and boot from the 1 TB disk. The layout now looks like this:
| Drive | Capacity | Nutanix Role |
|---|---|---|
| Lexar EQ790 NVMe | 1 TB | AHV boot and system disk |
| Intel Optane SSD 900P | 280 GB | First CVM disk |
| Lexar EQ790 NVMe | 2 TB | Second CVM disk |
| Samsung SSD 990 PRO | 2 TB | Nutanix data disk |
With this storage layout, I was finally able to deploy my cluster and bring it back up to the same state, but that also means my original goal—to use an Optane disk exclusively for the CVM—has officially failed. But by that point, I was already so far along that I wanted to run the tests anyway. It probably would have worked with a larger Optane disk. But I wasn’t willing to spend any more money. Since two flash disks are now assigned to the CVM, there is no guarantee that the OpLog will be stored only on the Optane drive. At least that’s what I thought, but more on that later. There has to be a little suspense, after all. The testing will once again be conducted using the same setup as before (more or less).
Test Results with Optane
To be honest, I was a little surprised and could hardly believe the results, but see for yourself.
Performance
| Test | Without Optane | With Optane | Change |
|---|---|---|---|
| Sequential Read 1 MiB | 2,587.0 MiB/s | 3,215.5 MiB/s | +24.3% |
| Sequential Write 1 MiB | 1,704.0 MiB/s | 954.7 MiB/s | -44.0% |
| Random Read 4K QD32 | 79,985 IOPS | 87,227 IOPS | +9.1% |
| Random Write 4K QD32 | 32,403 IOPS | 22,381 IOPS | -30.9% |
| Mixed 70/30 Read | 28,465 IOPS | 19,754 IOPS | -30.6% |
| Mixed 70/30 Write | 12,198 IOPS | 8,461 IOPS | -30.6% |
| Random Read 4K QD1 | 4,361 IOPS | 5,210 IOPS | +19.5% |
| Random Write 4K QD1 | 2,464 IOPS | 2,340 IOPS | -5.0% |
Average Latency - Lower latency is better.
| Test | Without Optane | With Optane | Change |
|---|---|---|---|
| Sequential Read 1 MiB | 6.140 ms | 4.935 ms | -19.6% |
| Sequential Write 1 MiB | 9.160 ms | 16.473 ms | +79.8% |
| Random Read 4K QD32 | 0.396 ms | 0.363 ms | -8.3% |
| Random Write 4K QD32 | 0.983 ms | 1.423 ms | +44.8% |
| Mixed 70/30 Read | 0.637 ms | 0.742 ms | +16.6% |
| Mixed 70/30 Write | 1.121 ms | 2.030 ms | +81.1% |
| Random Read 4K QD1 | 0.221 ms | 0.186 ms | -16.0% |
| Random Write 4K QD1 | 0.393 ms | 0.415 ms | +5.5% |
p99 Latency - Lower latency is better.
| Test | Without Optane | With Optane | Change |
|---|---|---|---|
| Sequential Read 1 MiB | 11.080 ms | 11.862 ms | +7.1% |
| Sequential Write 1 MiB | 22.680 ms | 38.011 ms | +67.6% |
| Random Read 4K QD32 | 0.758 ms | 0.651 ms | -14.1% |
| Random Write 4K QD32 | 2.610 ms | 5.603 ms | +114.7% |
| Mixed 70/30 Read | 2.020 ms | 1.843 ms | -8.8% |
| Mixed 70/30 Write | 5.410 ms | 5.931 ms | +9.6% |
| Random Read 4K QD1 | 0.864 ms | 0.578 ms | -33.2% |
| Random Write 4K QD1 | 1.204 ms | 0.946 ms | -21.4% |
Diagrams
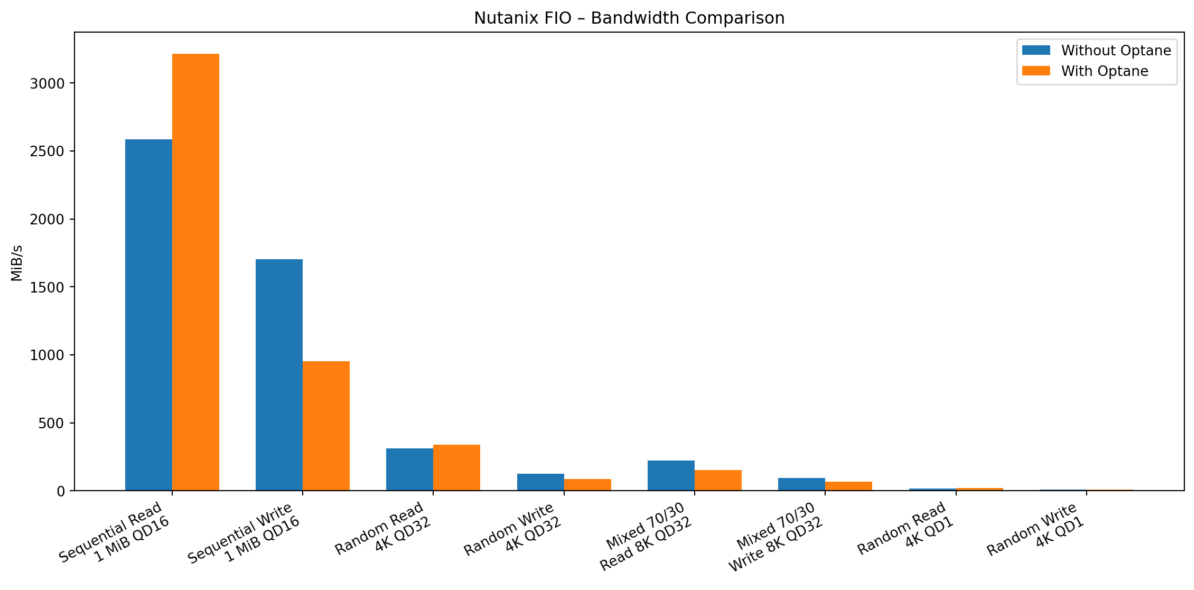
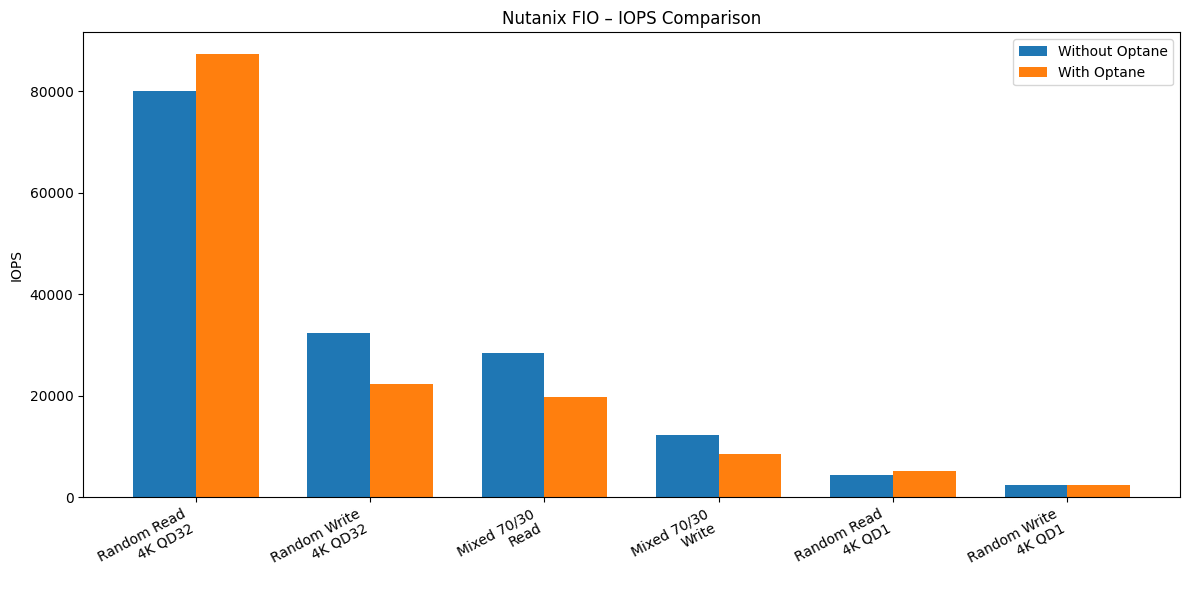
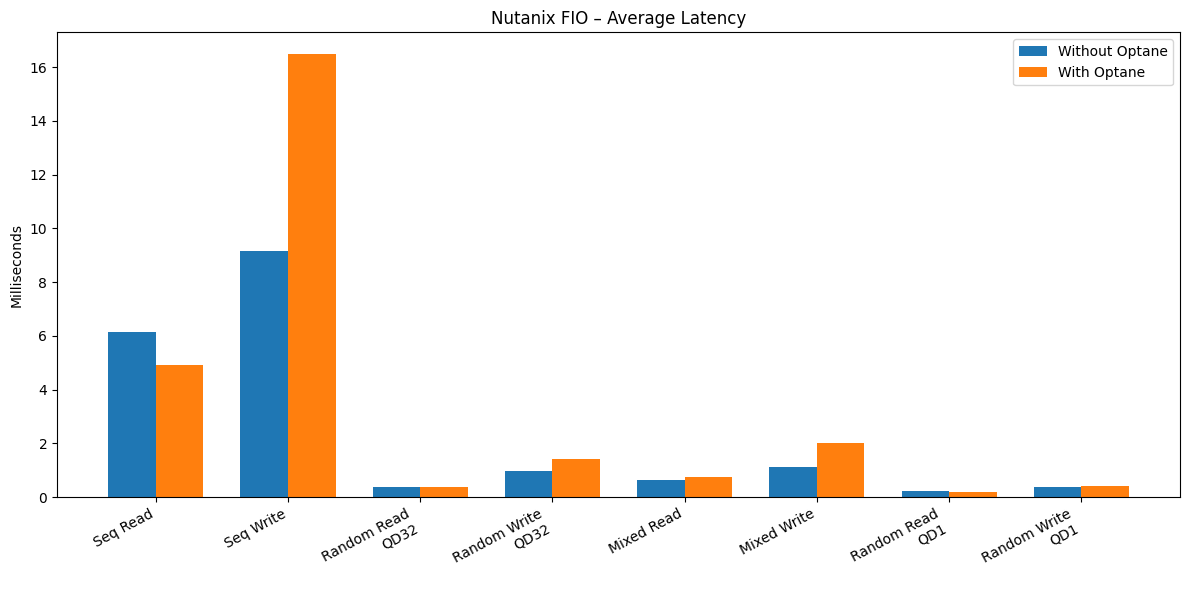
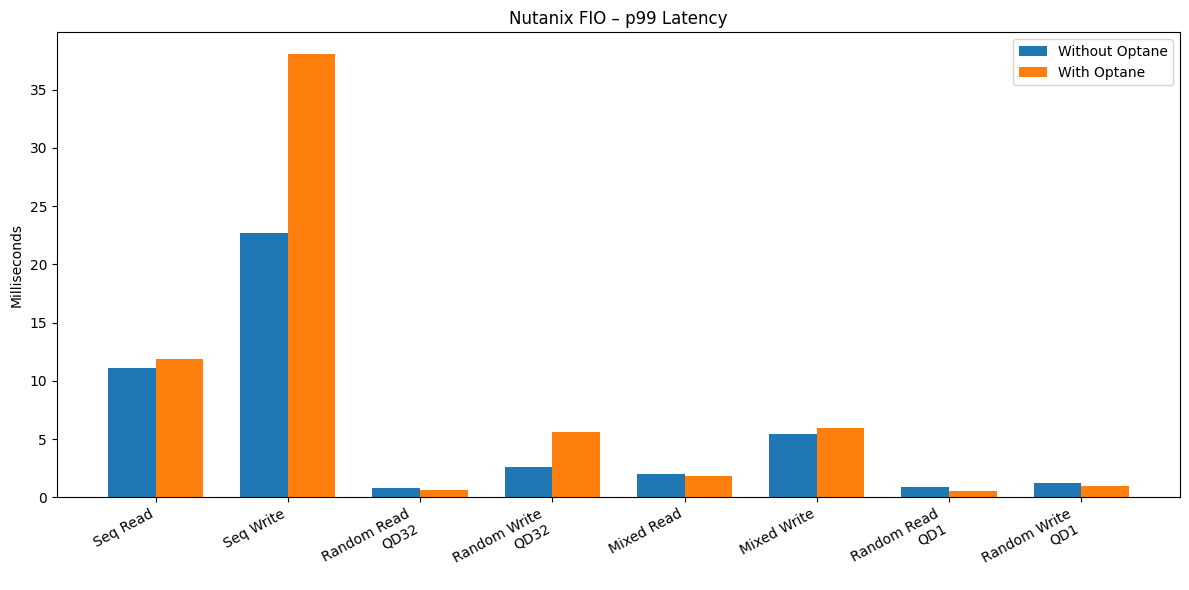
Since I wanted to rule out a defective Optane drive, I ran the same test again using an Optane drive and a bare-metal installation of Ubuntu.
Optane Native Performance Test
| Workload | Result | Average Latency | p99 Latency | p99.9 Latency |
|---|---|---|---|---|
| Sequential Read 1 MiB | 2,608.8 MiB/s | 5.969 ms | 6.128 ms | 9.372 ms |
| Sequential Write 1 MiB | 2,455.0 MiB/s | 6.324 ms | 9.896 ms | 10.027 ms |
| Random Read 4K QD32 | 399,728 IOPS | 0.0781 ms | 0.0876 ms | 0.0978 ms |
| Random Write 4K QD32 | 300,532 IOPS | 0.103 ms | 0.159 ms | 0.165 ms |
| Mixed 70/30 Read 8K QD32 | 131,297 IOPS | 0.169 ms | 0.261 ms | 0.297 ms |
| Mixed 70/30 Write 8K QD32 | 56,291 IOPS | 0.166 ms | 0.255 ms | 0.293 ms |
| Random Read 4K QD1 | 88,190 IOPS | 0.0096 ms | 0.0147 ms | 0.0356 ms |
| Random Write 4K QD1 | 76,993 IOPS | 0.0102 ms | 0.0143 ms | 0.0361 ms |
Performance Comparison
| Workload | Without Optane | With Optane | Native Optane |
|---|---|---|---|
| Sequential Read 1 MiB | 2,587.0 MiB/s | 3,215.5 MiB/s | 2,608.8 MiB/s |
| Sequential Write 1 MiB | 1,704.0 MiB/s | 954.7 MiB/s | 2,455.0 MiB/s |
| Random Read 4K QD32 | 79,985 IOPS | 87,227 IOPS | 399,728 IOPS |
| Random Write 4K QD32 | 32,403 IOPS | 22,381 IOPS | 300,532 IOPS |
| Mixed 70/30 Read 8K QD32 | 28,465 IOPS | 19,754 IOPS | 131,297 IOPS |
| Mixed 70/30 Write 8K QD32 | 12,198 IOPS | 8,461 IOPS | 56,291 IOPS |
| Random Read 4K QD1 | 4,361 IOPS | 5,210 IOPS | 88,190 IOPS |
| Random Write 4K QD1 | 2,464 IOPS | 2,340 IOPS | 76,993 IOPS |
Average Latency - Lower values are better.
| Workload | Without Optane | With Optane | Native Optane |
|---|---|---|---|
| Sequential Read 1 MiB | 6.140 ms | 4.935 ms | 5.969 ms |
| Sequential Write 1 MiB | 9.160 ms | 16.473 ms | 6.324 ms |
| Random Read 4K QD32 | 0.396 ms | 0.363 ms | 0.0781 ms |
| Random Write 4K QD32 | 0.983 ms | 1.423 ms | 0.103 ms |
| Mixed 70/30 Read 8K QD32 | 0.637 ms | 0.742 ms | 0.169 ms |
| Mixed 70/30 Write 8K QD32 | 1.121 ms | 2.030 ms | 0.166 ms |
| Random Read 4K QD1 | 0.221 ms | 0.186 ms | 0.0096 ms |
| Random Write 4K QD1 | 0.393 ms | 0.415 ms | 0.0102 ms |
p99 Latency - Lower values are better.
| Workload | Without Optane | With Optane | Native Optane |
|---|---|---|---|
| Sequential Read 1 MiB | 11.080 ms | 11.862 ms | 6.128 ms |
| Sequential Write 1 MiB | 22.680 ms | 38.011 ms | 9.896 ms |
| Random Read 4K QD32 | 0.758 ms | 0.651 ms | 0.0876 ms |
| Random Write 4K QD32 | 2.610 ms | 5.603 ms | 0.159 ms |
| Mixed 70/30 Read 8K QD32 | 2.020 ms | 1.843 ms | 0.261 ms |
| Mixed 70/30 Write 8K QD32 | 5.410 ms | 5.931 ms | 0.255 ms |
| Random Read 4K QD1 | 0.864 ms | 0.578 ms | 0.0147 ms |
| Random Write 4K QD1 | 1.204 ms | 0.946 ms | 0.0143 ms |
Diagrams
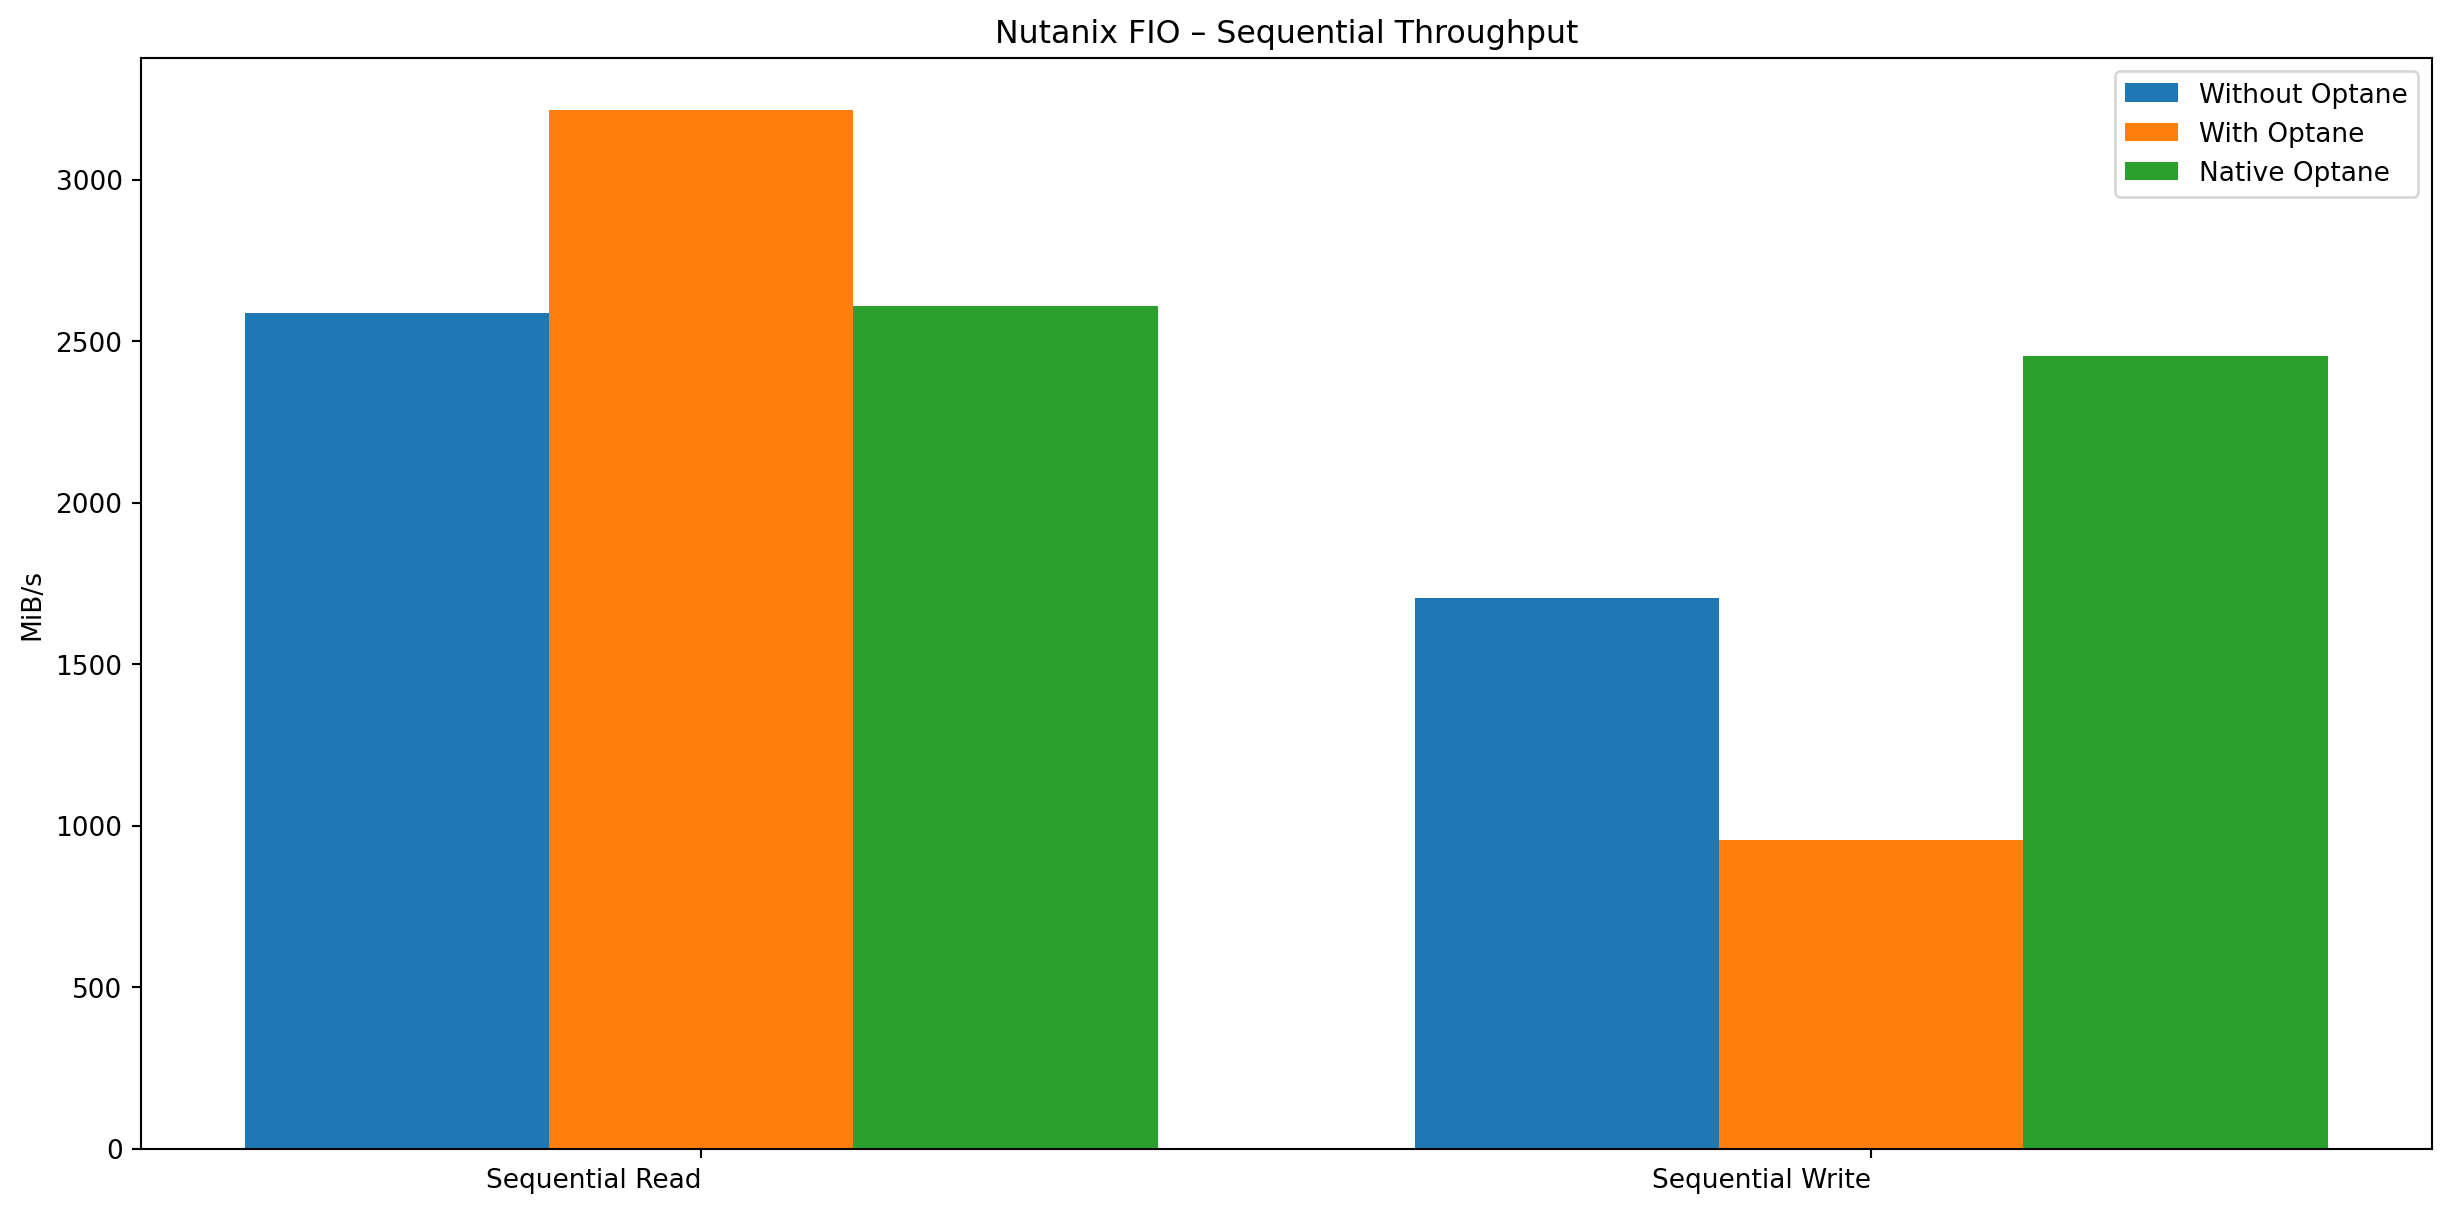
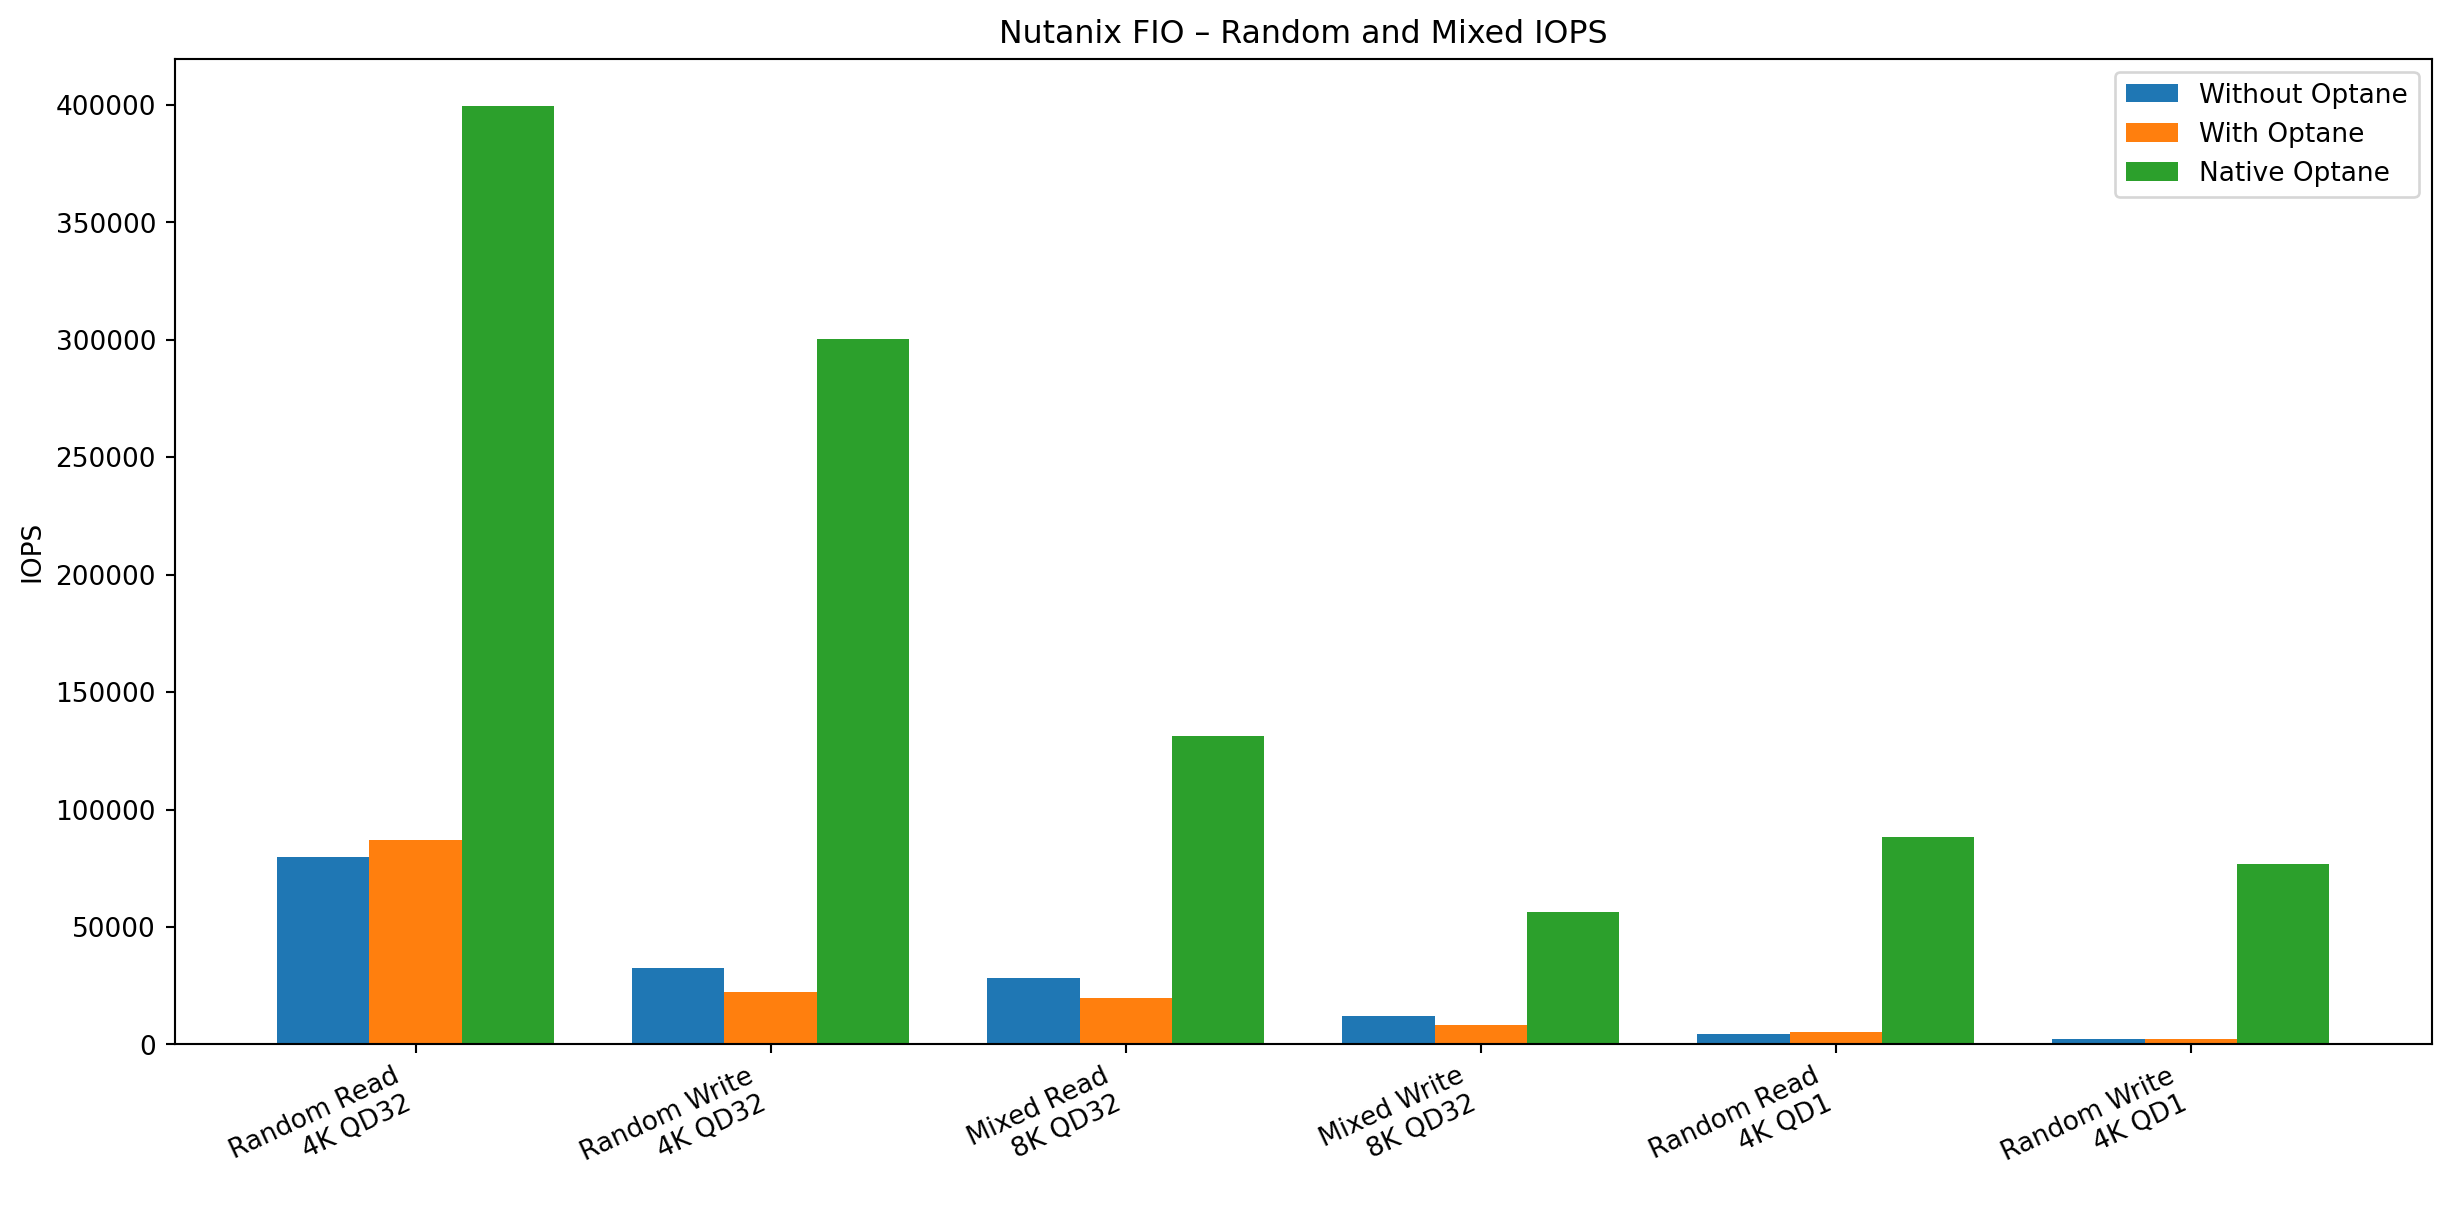
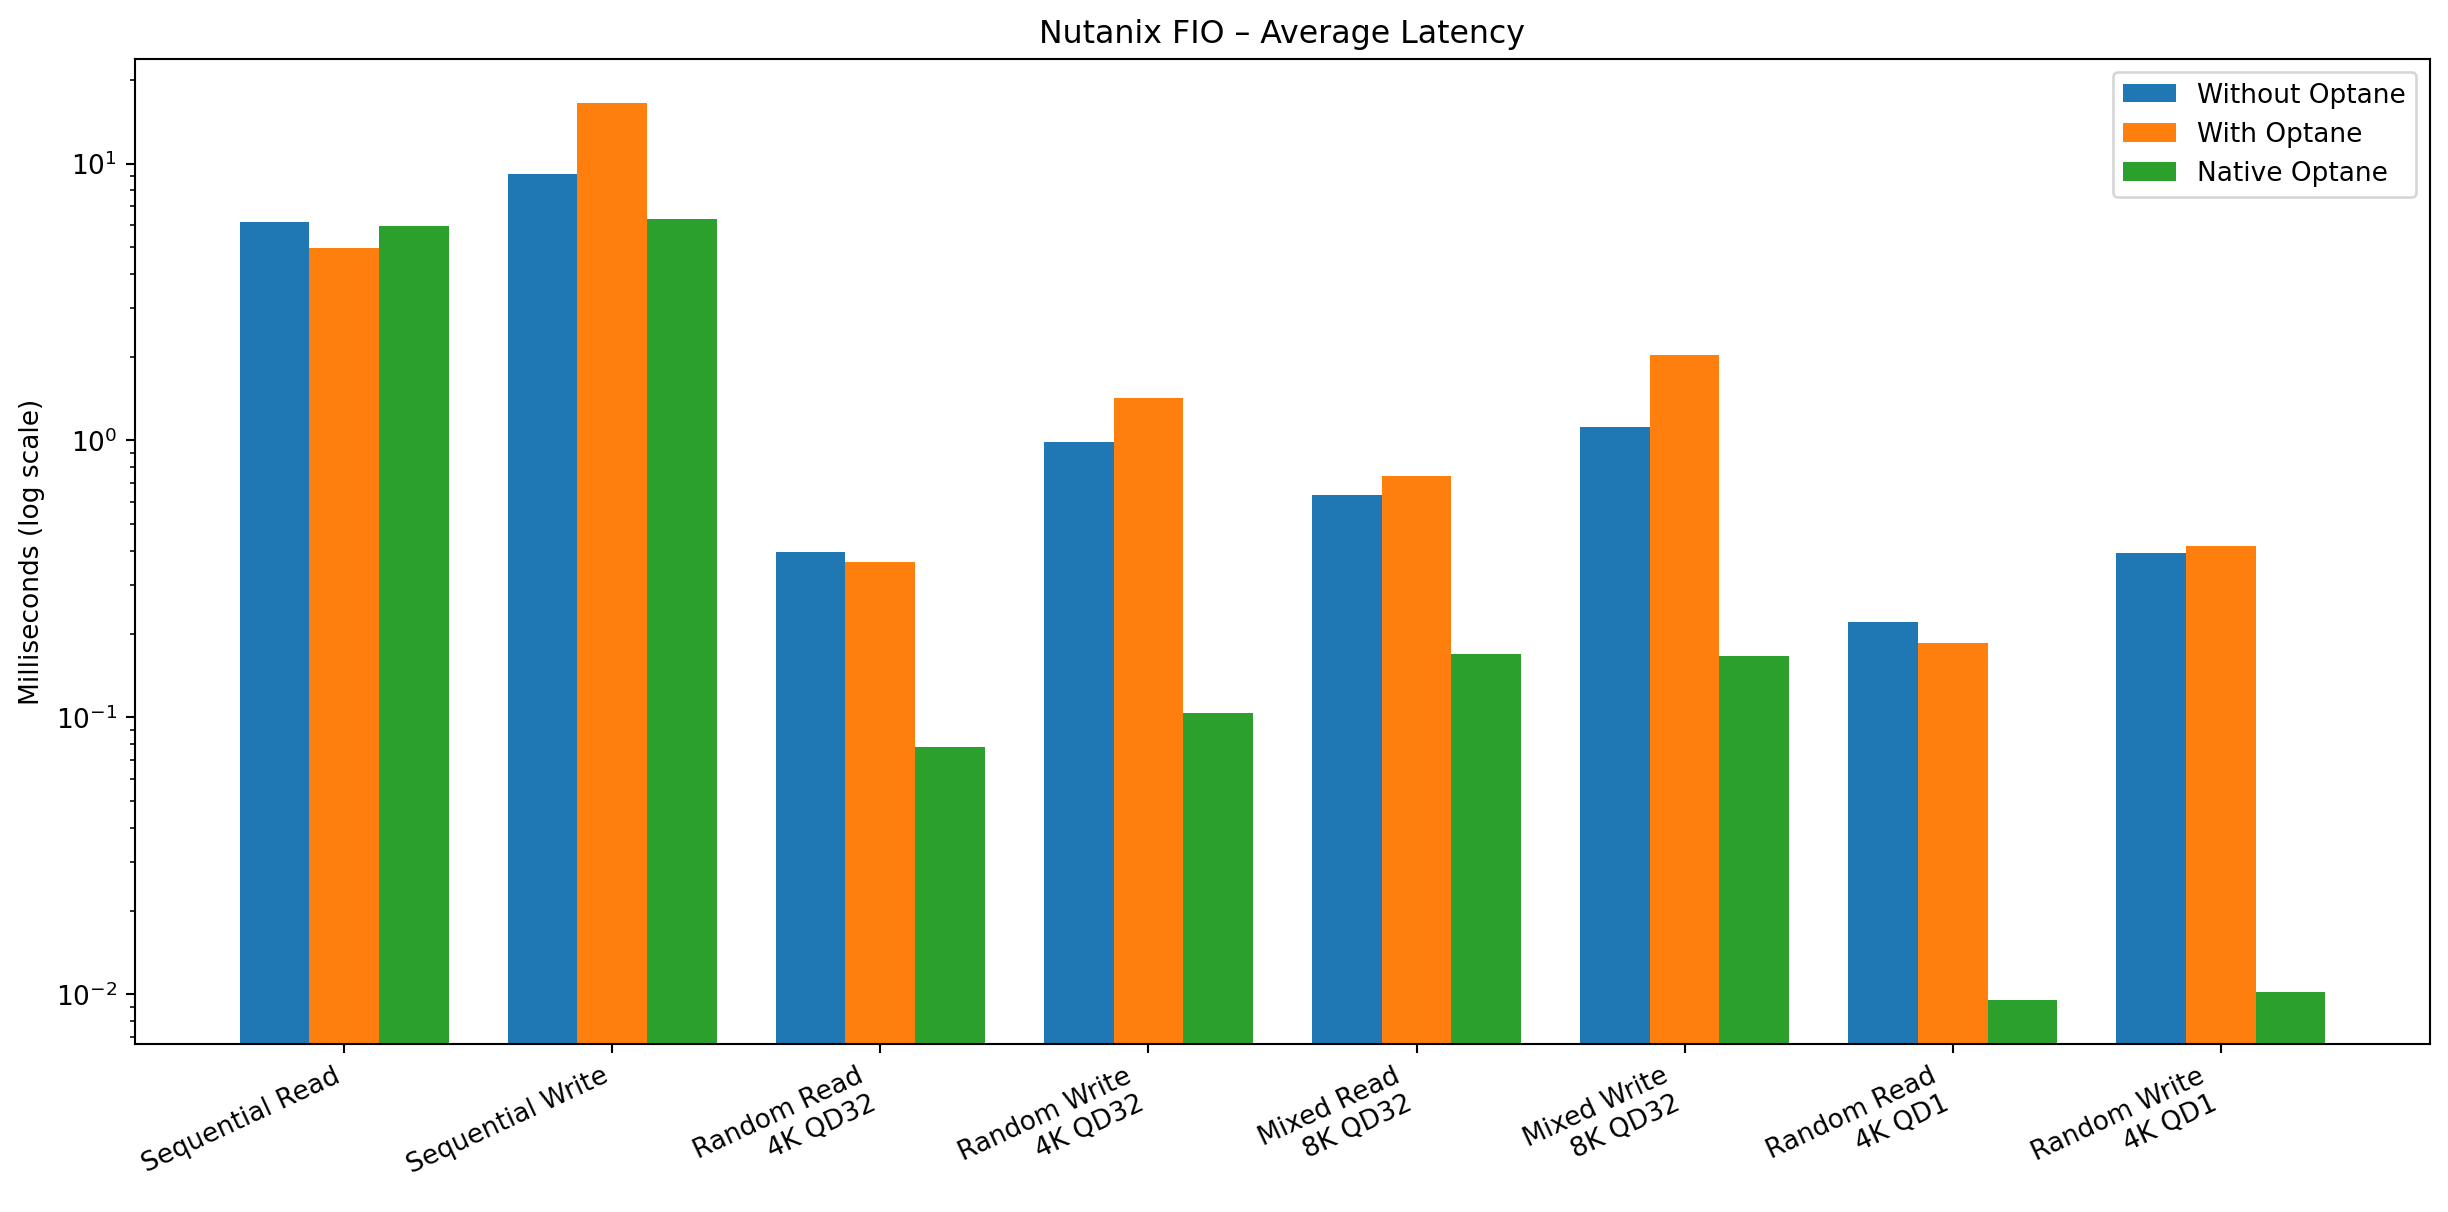
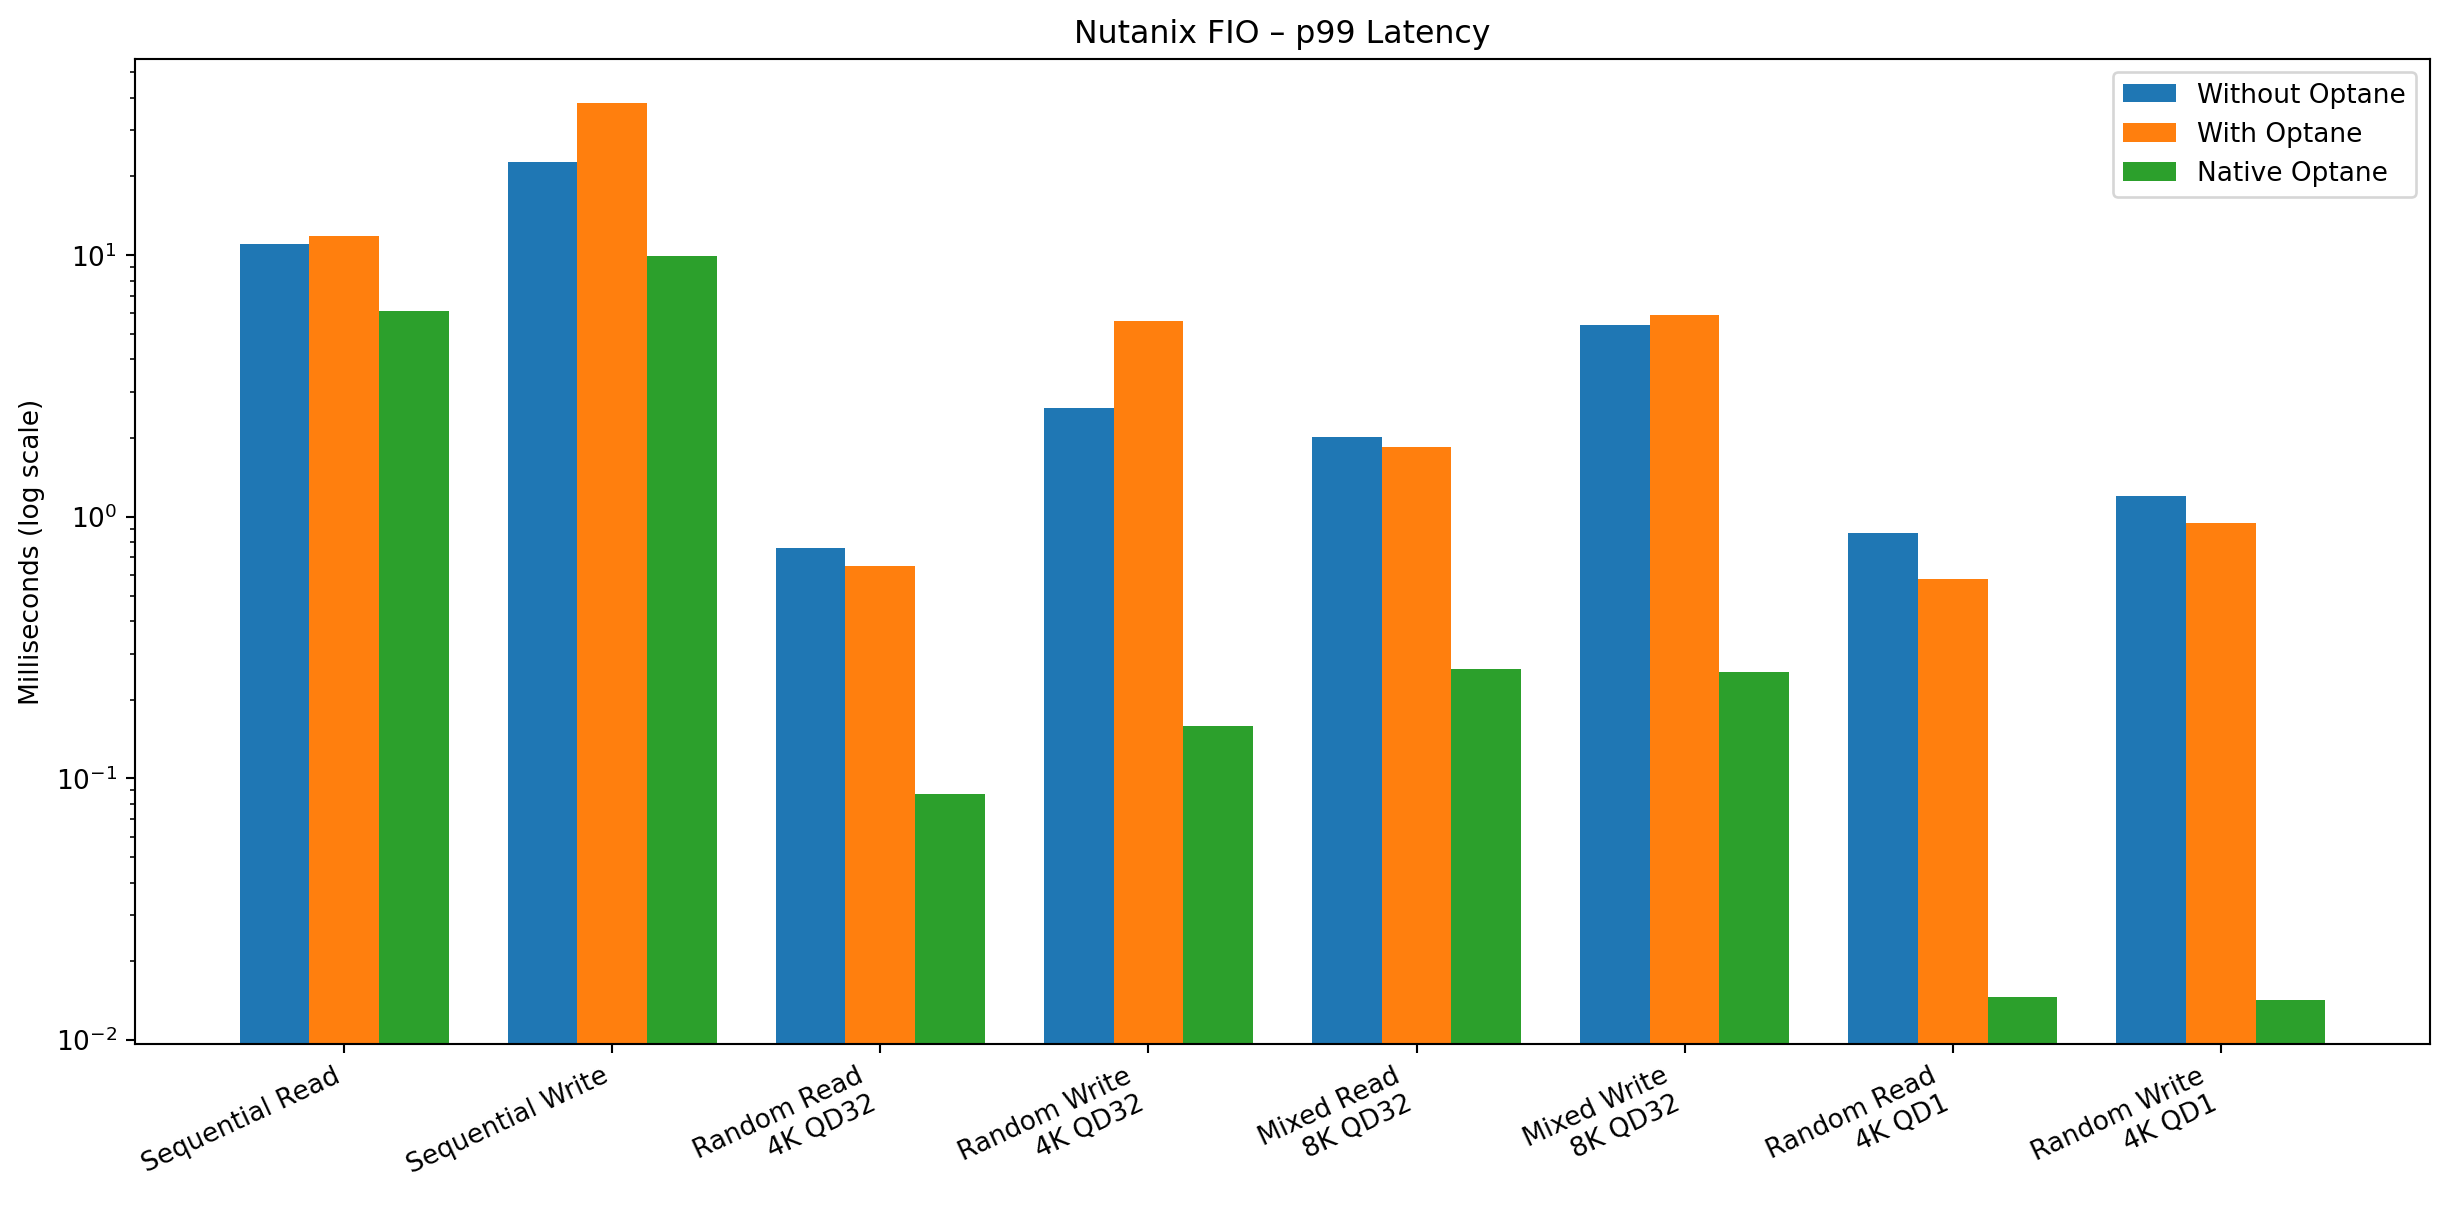
Interpretation — An Attempt
Mission failed — at least that was my first thought — and man, that was an expensive little adventure. But it’s no use — failure is part of the process — but what’s actually going on with my system right now?
If you take a closer look at the Stargate logs, you’ll also see that, out of my Optane’s approximately 260 GB of usable capacity, only about 15.3 GB is available for the OpLog. Since all disks belong to the same storage tier, all my NVMe drives receive an OpLog reservation. In the case of a 2 TB NVMe drive, that amounts to about 185 GB for the OpLog. This confirms once again that my assumption about how Nutanix storage works was completely wrong.
grep -aEh \
'OpLog_disk_size.*(PHMB7470005W280CGN|S6Z2NU0XB04165Y)|disk_serial_id: "(PHMB7470005W280CGN|S6Z2NU0XB04165Y)"' \
~/data/logs/stargate* 2>/dev/null | tail -20
Here’s the log excerpt; it’s not exactly easy to read, but one of the most important pieces of information is:
OpLog_disk_size: 16481369332
W20260728 20:34:21.916383Z 90697 stargate_cluster_state.cc:2167] Disk Usage stat for disk 13 not found , proto=disk_id:
13 service_vm_id: 2 mount_path: "/home/nutanix/data/stargate-storage/disks/PHMB7470005W280CGN" disk_size: 149803025165
statfs_disk_size: 208943841280 storage_tier: "SSD-PCIe" data_dir_sublevels: 2 data_dir_sublevel_dirs: 20
data_migration_status: 0 disk_location: 4 contains_metadata: true OpLog_disk_size: 16481369332 disk_serial_id:
"PHMB7470005W280CGN" disk_uuid: "6143c190-14ad-4651-8522-3582c84e5e71" node_uuid:
"f3b7a7f2-b9b5-4a09-a58f-066de1eadf9a" chosen_for_metadata: false metadata_disk_reservation_bytes: 32212254720 self_managed_nvme: false trim_enabled: true
On one of my 2 TB hard drives, the log entry looks like this:
Disk Usage stat for disk 12 not found , proto=disk_id: 12 service_vm_id: 2 mount_path: "/home/nutanix/data/
stargate-storage/disks/S6Z2NU0XB04165Y" disk_size: 1702077037813 statfs_disk_size: 2000362143744 storage_tier:
"SSD-PCIe" data_dir_sublevels: 2 data_dir_sublevel_dirs: 20 disk_location: 1 oplog_disk_size: 198266995467
disk_serial_id: "S6Z2NU0XB04165Y" disk_uuid: "f03121e0-e726-4aea-af6c-fe2faba8ea4b" node_uuid:
"f3b7a7f2-b9b5-4a09-a58f-066de1eadf9a" block_store_device_info { format_needed: false start_offset_bytes: 35651584
end_offset_bytes: 2000397795327 } self_managed_nvme: false trim_enabled: true
In an Optane-plus-NVMe configuration, Nutanix does not use Optane as the exclusive location for the OpLog. The OpLog is distributed across both Optane and NVMe devices, which means that the slower NVMes remains part of the write path for the OpLog and can undermine the latency advantage of Optane. As a result, burst writes may be distributed across different disks, and the varying latencies of those disks could have a negative impact.
However, in my opinion, the OpLog alone does not explain all the results. Persistent and sequential write operations can bypass the OpLog and go directly to the Extent Store. However, the lower performance during sequential write operations cannot be attributed to a single component. The different physical hard drive layout, data placement, replication path, cache status, thermal conditions, and the characteristics of the other consumer-class NVMe devices could all have contributed to this.
The native benchmark clearly shows that my Optane drives were not defective or inherently slow, and confirms that the devices can deliver the expected performance with low latency. The real problem was my assumption that adding an “extremely fast” device would automatically speed up the entire storage stack.
And now…
Well, what can I say? Sometimes you make smart investments in your home lab, and sometimes you don’t. To put it bluntly, you could just say “RTFM” before buying hardware for over 500 euros. But that’s not the point—I’ve learned a lot about the Nutanix storage system over the last few days, and I can help you avoid making the same mistake. I’m not sure yet what I’ll do with the Optane disks—maybe I’ll add them to my Proxmox cluster. In my VCF cluster, they’re doing an outstanding job as memory tiering devices. I’m sure I’ll find a use for them. I hope you had fun watching me fail. And as I said at the beginning, Nutanix can’t be blamed for this.