VCF 9.1 - Platform Health Check Error
During the deployment of an additional VCF 9.1 component, the precheck failed with the following platform health error: Platform Health Check Error [platform-statefulsets-core : 1 of 10 resources are not ok:logging-operator-fluentd: wrong resource state: InProgress - Ready: 0/1;][VCFMS-HEALTH-002]
vcf9.1serviceclusterkubernetes
1559 Words // ReadTime 7 Minutes, 5 Seconds
2026-06-14 12:00 +0200
Introduction
I wanted to deploy another component in my VCF 9.1 cluster and ran into a cryptic error message that I couldn’t quite make sense of at first. Some of you might be familiar with this error message; in any case, I’ve seen posts on LinkedIn from people who seem to be having the same problem. I’m referring to the following error message.
So I started looking into it, but I couldn’t find any relevant errors in VCF Operations. Everything looked fine at first glance, but no matter how many times I tried, I couldn’t deploy any more components. Since the VCF Service Cluster is essentially just a Kubernetes cluster, it was time to take a closer look. Let’s get started.
Accessing the VCF Service Cluster
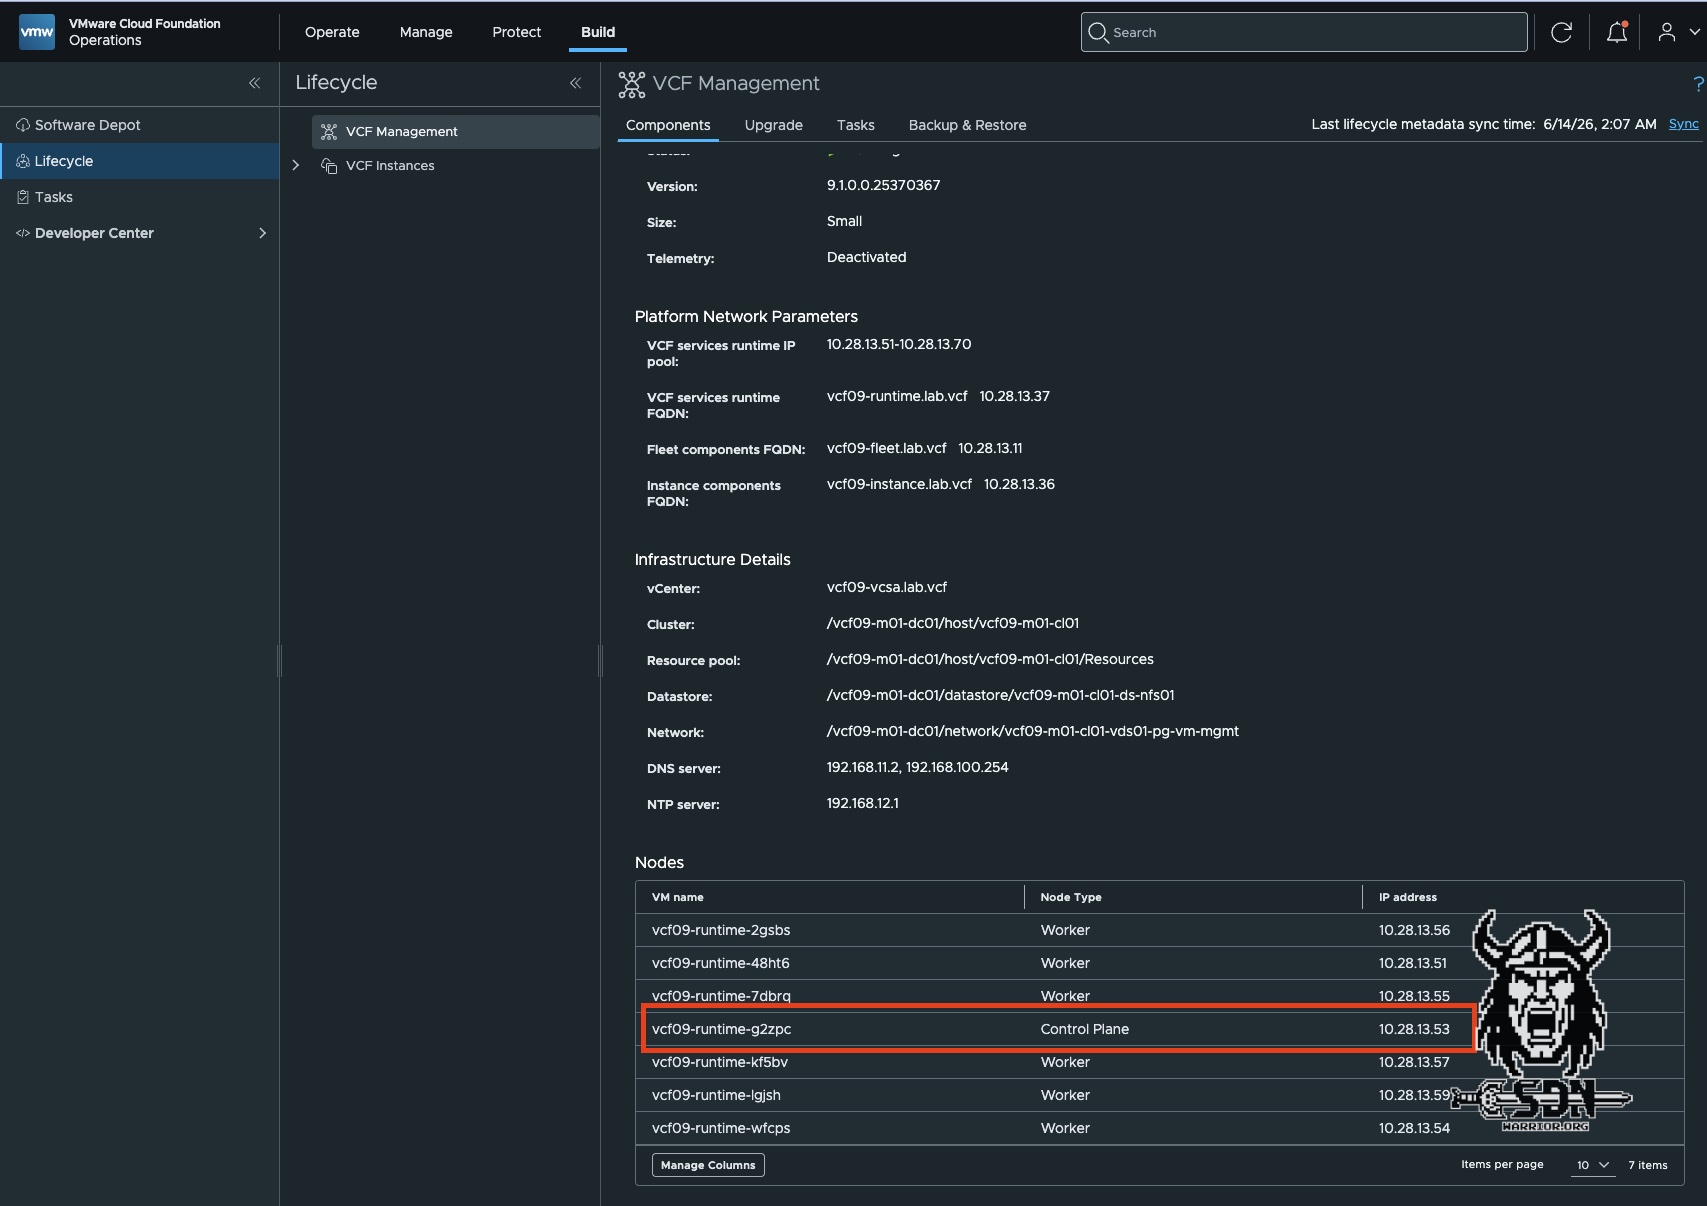
This was my first hurdle: how do I even access the service cluster? Well, that’s relatively simple. I connect via SSH to the control node of the service cluster. You can find the IP address of the control plane under Build -> Lifecycle -> VCF Managment -> Components -> VCF Services Runtime in VCF Operations, or you can retrieve the IP from vCenter. Of the service runtime VMs, the control plane VMs are the smallest. In a simple deployment, there is only one control plane VM.
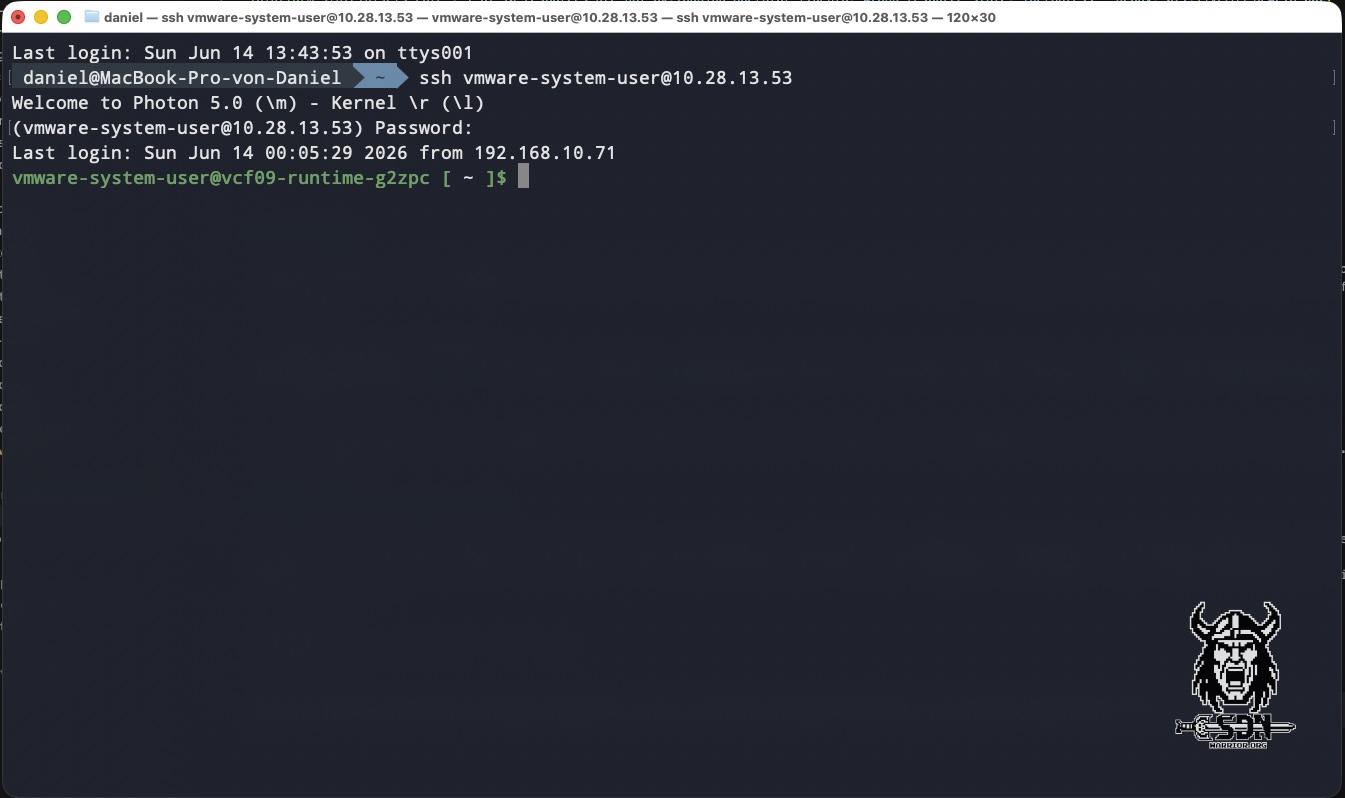
You can retrieve the password from the VCF Installer, as it is initially generated randomly. If you haven’t saved the passwords, you can still retrieve them via the API as usual. The user is the vmware-system-user, and you can use this account to log in to the control plane node. To work properly, you need the correct kubeconfig, because none is loaded at login, and without the correct kubeconfig, kubeclt will try to connect to localhost:8080 and fail. The correct kubeconfig is located at /etc/kubernetes/admin.conf, and to make things easier for myself, I set an alias.
alias k='sudo KUBECONFIG=/etc/kubernetes/admin.conf kubectl'
To test the alias, you can run a simple cluster-info command; the result should look something like this:
vmware-system-user@vcf09-runtime-g2zpc [ ~ ]$ k cluster-info
[sudo] password for vmware-system-user:
Kubernetes control plane is running at https://10.28.13.52:6443
CoreDNS is running at https://10.28.13.52:6443/api/v1/namespaces/kube-system/services/kube-dns:dns/proxy

To further debug and diagnose cluster problems, use 'kubectl cluster-info dump'.
Okay, now that we’ve successfully logged in, we can continue investigating the cause.
Where’s the Poop, Robin?
I hope you catch the reference to the great show How I Met Your Mother. Anyway. The error message indicated that there seems to be an issue with Fluentd, so let’s take a closer look at it. There is a simple health check you can run:
curl -k https://<PRIMARY_VIP>:30006/status | jq
You get a simple list in JSON format that lists all services and their status. If all services are running, it looks something like this (I have edited this excerpt.):
{
  "checkset-vodap-ccs-http": {
    "ok": true,
    "lastError": "failed to execute \"GET\" request: Get \"https://vcf-obs-collector-controller-service.vodap.svc.cluster.local:8443/health/readiness\": dial tcp 198.18.129.65:8443: connect: connection refused",
    "timestamp": "2026-06-14T12:15:24Z",
    "duration": "14.66674ms",
    "contiguousFailures": 0,
    "lastTransitionTime": "2026-06-14T11:53:24Z",
    "labels": {
      "clustername": "vcf09-runtime",
      "component": "vcf-obs-data-platform",
      "name": "checkset-vodap-ccs",
      "status": "success",
      "type": "http"
    }
  },
  "checkset-vodap-dqs-http": {
    "ok": true,
    "timestamp": "2026-06-14T12:15:25Z",
    "duration": "19.182295ms",
    "contiguousFailures": 0,
    "lastTransitionTime": null,
    "labels": {
      "clustername": "vcf09-runtime",
      "component": "vcf-obs-data-platform",
      "name": "checkset-vodap-dqs",
      "status": "success",
      "type": "http"
    }
  }
}
There’s some interesting information to be found here. For one thing, you can see the current status, which can be “successful” or “error,” for example, and you can tell whether the service is working properly. The “Last Error” is also interesting. As the name suggests, this shows the last error the service encountered. In my example, the services are working properly.
And here we have our problem child—and the reason why no further components can be deployed.
{
 "platform-statefulsets-core": {
    "ok": false,
    "lastError": "1 of 10 resources are not ok: logging-operator-fluentd: wrong resource state: InProgress - Ready: 0/1;",
    "timestamp": "2026-05-20T17:25:56Z",
    "duration": "6.461603ms",
    "contiguousFailures": 547,
    "lastTransitionTime": "2026-05-20T12:34:44Z",
    "labels": {
      "clustername": "vcf09-runtime",
      "component": "vsp",
      "name": "platform-statefulsets",
      "status": "error",
      "type": "core"
    }
  }
}
Next, I’ll check to see if all the containers are ready. If the error message is correct, something in Fluentd isn’t in the “ready” state.T o do this, I run two commands:
k get sts -A | grep logging-operator-fluentd
k get pods -A -o wide | grep logging-operator-fluentd
vmware-system-user@vcf09-runtime-g2zpc $ k get sts -A | grep logging-operator-fluentd
vmsp-platform logging-operator-fluentd 0/1 7d20h

vmware-system-user@vcf09-runtime-g2zpc $ k get pods -A -o wide | grep logging-operator-fluentd

vmsp-platform logging-operator-fluentd-0 1/2 Running 221 (5m15s ago) 6d20h 198.18.2.38 vcf09-runtime-wfcps <none> <none>
vmsp-platform logging-operator-fluentd-configcheck-97bae691 0/1 Completed 0 6d20h <none> vcf09-runtime-wfcps <none> <none>
As you can see in the output, only 1 of the 2 containers is running. The container named logging-operator-fluentd-0 has had over 221 restarts. This means it is stuck in a crash loop. Next, I’ll define a variable for the namespace NS=vmsp-platform so I don’t have to type it out every time. I’ll do the same for the actual pod POD=logging-operator-fluentd-0. I use k -n $NS describe pod $POD to get the description of the actual pod.
This is where it gets interesting. Fluentd checks two things: first, whether less than 80% of the storage space is used, and second, whether there are fewer than 10,000 files. If either of these two criteria is met, the pod will not start up properly. Excerpt from the issue of describe:
FREESPACE_THRESHOLD=80
FREESPACE_CURRENT=$(df -h $BUFFER_PATH | grep / | awk '{ print $5}' | sed 's/%//g')

MAX_FILE_NUMBER=10000
FILE_NUMBER_CURRENT=$(find $BUFFER_PATH -type f -name *.buffer | wc -l)
Next, I used a small script to identify exactly these two potential issues.
NS=vmsp-platform
POD=logging-operator-fluentd-0

k -n $NS exec -it $POD -c fluentd -- bash -lc '
echo "=== /buffers filesystem ==="
df -h /buffers

echo
echo "=== buffer file count ==="
find /buffers -type f -name "*.buffer" | wc -l

echo
echo "=== buffer directory size ==="
du -sh /buffers'
This output clearly shows that the problem for me wasn’t the number of files, but simply the amount of memory being used. There are simply over 8 GB of files in the /buffers directory.
=== /buffers filesystem ===
Filesystem      Size  Used Avail Use% Mounted on
/dev/sde         10G  8.3G  1.7G  84% /buffers

=== buffer file count ===
18

=== buffer directory size ===
8.2G	/buffers
With this simple Bash command, I can see which directory contains the files that are taking up my disk space.
k -n $NS exec -it $POD -c fluentd -- bash -lc '
echo "=== top level usage ==="
du -h --max-depth=2 /buffers 2>/dev/null'
=== top level usage ===
8.36G	/buffers/backup/worker0
8.36G	/buffers/backup
8.36G	/buffers
We’ve identified the problem, but not the cause. So I’m checking the logs to see if I can find anything out of the ordinary.
k -n vmsp-platform logs logging-operator-fluentd-0 -c fluentd --tail=300
And while going through the logs, I noticed that the URL for my Operations for Logs kept popping up: vcf09-li.lab.vcf:9543/api/v2/events, which made me suspicious. It turns out that my Operations for Logs is currently unavailable because I had stopped it via the Operations UI before the last VCF shutdown and simply forgot to restart it. Since the service was properly stopped via Operations, it naturally doesn’t appear in the list of services with issues. That was a classic Layer 8 problem. Since Fluentd couldn’t get rid of its logs, they were moved to the backup directory, and so, slowly but surely, the storage space filled up.
Lab fix
So my straightforward solution was to launch Operations for Logs and simply delete the Fluentd logs from the backup directory. I don’t know if Fluentd would have recovered on its own, but I just didn’t want to wait.
You can easily delete the logs using this bash command:
k -n $NS exec -it $POD -c fluentd -- bash -lc '
find /buffers/backup -type f -delete
df -h /buffers
du -sh /buffers/backup
'
After deleting the logs, I simply deleted the pod and redeployed it. After that, the pod started up without any issues, and I was able to deploy my VCF component without any errors.
k delete pod -n $NS $POD
k -n $NS rollout status sts/logging-operator-fluentd --timeout=10m
Summary
The whole troubleshooting process dragged on for several hours, and of course I went down the wrong path a few times. I’m no Kubernetes expert either, and if this were a production system, I would definitely have brought in Broadcom support. So take this solution with a grain of salt and think before you delete anything. It worked perfectly for me. I hope this helps someone out there.
